Macro & Policy
Rates, inflation and the policy that moves them
Central bank decisions, jobs prints and fiscal policy, read the way a portfolio reads them: what reprices, by how much, and what would change the call.
2026-08-05
%22%2F%3E%0A%20%20%3Ccircle%20cx%3D%22220%22%20cy%3D%22150%22%20r%3D%22180%22%20fill%3D%22%2322d3ee%22%20fill-opacity%3D%220.12%22%2F%3E%0A%20%20%3Ccircle%20cx%3D%221010%22%20cy%3D%22130%22%20r%3D%22220%22%20fill%3D%22%2338bdf8%22%20fill-opacity%3D%220.08%22%2F%3E%0A%20%20%3Ccircle%20cx%3D%22920%22%20cy%3D%22520%22%20r%3D%22170%22%20fill%3D%22%2322d3ee%22%20fill-opacity%3D%220.06%22%2F%3E%0A%20%20%3Cpath%20d%3D%22M140%20430h920%22%20stroke%3D%22url(%23line)%22%20stroke-width%3D%2212%22%20stroke-linecap%3D%22round%22%2F%3E%0A%20%20%3Cpath%20d%3D%22M220%20360c120-150%20260-220%20380-220s260%2070%20380%20220%22%20fill%3D%22none%22%20stroke%3D%22%2367e8f9%22%20stroke-opacity%3D%220.5%22%20stroke-width%3D%2216%22%20stroke-linecap%3D%22round%22%20stroke-linejoin%3D%22round%22%2F%3E%0A%20%20%3Cpath%20d%3D%22M300%20398h600%22%20stroke%3D%22%2394a3b8%22%20stroke-opacity%3D%220.24%22%20stroke-width%3D%228%22%20stroke-linecap%3D%22round%22%2F%3E%0A%20%20%3Ctext%20x%3D%22220%22%20y%3D%22510%22%20fill%3D%22%23e2e8f0%22%20fill-opacity%3D%220.7%22%20font-family%3D%22Arial%2C%20Helvetica%2C%20sans-serif%22%20font-size%3D%2238%22%20letter-spacing%3D%228%22%3EINSIGHTS%3C%2Ftext%3E%0A%3C%2Fsvg%3E)

Services-ISM’s input-cost surge is the first “Fed cut re-ignition” signal—because it pressures prices without breaking growth
In the July Services ISM print, the key tension isn’t just “activity stayed strong”—it’s that input costs re-accelerated into the quarter, with the report explicitly flagging the brunt landing in Q3 2026. That mix historically delays the speed of Fed cuts versus the same activity-strength with falling prices, and it quietly shifts how markets should interpret the next inflation data.

S&P 500’s first 7,700 close rewards cyclicals, not AI—because Hormuz de-escalation reprices the “oil risk premium”
The Aug. 4 move looks like a pure tech-led rally, but the Dow’s +907 point surge vs the Nasdaq’s +2.6% pop signals investors are rotating into cyclicals that benefit directly when Hormuz-risk compresses oil and shipping insurance. With oil trading below ~$80 amid de-escalation chatter, the first 7,700 print becomes a sector composition signal—not just a momentum milestone.

Wells Fargo’s “AI trickle-down” reframes Industrials: the winners are the grid-and-automation bottleneck, not just the factory-build line
Wells Fargo’s Aug 4 framing that hyperscaler AI spending is “trickling down” into older industrial supply chains makes the AI trade less about Mag-7 capex optics and more about domestic, capacity-constrained build cycles. The investable map is concentrated in electrification + control/automation equipment where capex shifts translate into order intake and backlog visibility—while broad-cycle heavy equipment is more rate-and-cycle sensitive.
2026-08-04
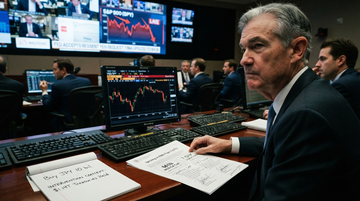
Bessent’s yen request turned the Fed’s FX backstop into a global market-shock switch—starting with $60B per week
When Scott Bessent urged the Fed to “upsiz[e]” its FIMA Repo Facility, the US stopped treating yen defense as just a Treasury operation. That matters because the Fed backstop (up to $60B in USD lending for up to seven days) can amplify cross-border funding stress and make “155 per dollar” a global volatility trigger rather than a Japan-only headline.

Toyota’s weak-yen “profit” story is increasingly a China-write-off + FX-translation trade, not a demand rebound
Toyota is guiding higher operating profit even as it warns China weakness is persisting, turning the weak-yen tailwind into an accounting translation effect rather than a volume recovery. For investors, that means the next catalyst is less about Japanese pricing power and more about whether FX tailwinds survive and whether China demand stabilizes.

America’s trade deficit shrank because imports fell—watch the supply-chain “pause” behind the headline
In June, the U.S. goods trade deficit narrowed to $101.5B largely because imports of goods fell $8.2B m/m. That looks GDP-friendly on the surface, but it can also signal a demand pause and inventory/freight timing effects—typically showing up first in logistics and in companies with high import exposure.
2026-08-03

The July Jobs Report Must Clear a 57,000 Payroll Bar—But the 4.70% 10-Year Has Already Priced a Hawkish Rebound
The Federal Reserve’s 9–3 hold on July 29 was more hawkish than the headline: three officials wanted an immediate hike, and Chair Kevin Warsh said higher underlying inflation would trigger tightening. July payrolls therefore matter through wages and labor supply, not merely the job count. A hot combination would validate the 68% prediction-market odds of a 2026 hike and pressure duration-sensitive assets; a weak, broad-based report would challenge a 10-year Treasury yield already at 4.70%.

Tom Lee’s 2027 “best year” only works if mega-caps keep leading while SpaceX-or-Fed shocks don’t reprice risk—here’s the trade book
Tom Lee’s bullish 2027 setup is best understood as a conditions trade: mega-caps must keep capturing AI earnings momentum while the market digests massive tech IPO supply and avoids a Fed-led tail unwind. The concrete test is whether leadership stays narrow (NVDA/META/GOOGL/AXP/CVX) or spreads into the small-cap bridge—because if it doesn’t, “best year” becomes a liquidity/valuation story rather than an earnings story.
2026-08-02

Ares Printed $36B in a Quarter. The Same Quarter It Capped Withdrawals on a $10.7B Fund.
Ares Management hauled a record $36B in Q2 2026 and stacked it on top of $30B in Q1 — yet the same firm capped redemptions at 5% on its Ares Strategic Income Fund because quarterly withdrawal demand hit 14.4% of NAV. The fundraising headline conceals a two-speed market: closed-end flagship and BDC vehicles absorb a record wave of institutional capital, while the open-end retail-facing fund faces the worst redemption stress in its history. For investors, the trade is not 'private credit is the risk' or 'private credit is the trade' — it is the wedge between them.

OPEC+’s 188 kbpd Hike Is Too Small to Beat a 2.2 mbpd Inventory Draw
OPEC+ approved a 188,000-barrel-per-day September increase on August 2, but it did not formally promise the widely anticipated pause. The deeper signal is a split market: demand is weakening, yet Iran-war outages and depleted inventories still favor refiners and integrated producers over airlines. That makes Chevron and Valero Energy the cleaner near-term exposures, while Delta Air Lines remains the clearest casualty of expensive fuel.

The Small-Cap Rally Is Real—but August Must Prove It Is More Than a Rate-Cut Trade
The Russell 2000’s reported 10.3% July gain against a 1.2% rise for the S&P 500 marked a sharp breadth shift, but the evidence is not yet strong enough to call it a durable earnings cycle. Regional banks, industrials, energy and AI-infrastructure names all contributed to the broader move, while the Federal Reserve’s 3.50%–3.75% policy range keeps the trade highly sensitive to rates. August’s test is simple: do earnings revisions and credit conditions validate the rally, or does crowded positioning reverse?
2026-08-01

A Yen Buyer Has Joined the Trade—and It Is Changing the Intervention Math
The July 31, 2026 Japan–South Korea currency operation was reported as potentially involving the United States, but the evidence opened this session does not verify the brief’s claimed $5–10 billion Treasury purchase. The investable shift is still material: Washington’s reported willingness to coordinate converts intervention from a Tokyo-only defense into a policy signal that can reprice yen carry, exporter earnings, and cross-currency liquidity before any official Treasury balance-sheet purchase is confirmed.

The Q2 ECI Did Not Re-Accelerate—But It Still Makes a September Fed Cut Harder
The July 31 Employment Cost Index report confirmed that quarterly compensation growth held at 0.9%, while private-sector annual wage growth slowed to 3.1% and real wages fell 0.4%. The signal is less a wage shock than a policy trap: inflation remains elevated, the Fed has already removed its easing bias, and a soft labor market gives policymakers little reason to ease quickly.
2026-07-31

2026-07-30

Did the Fed’s “worst-long-bond-day” finally break the 30-year Treasury auction? The market is about to learn via the bid-cover vs. tail
Today’s $25B 30-year auction is the first real stress test of whether foreign/indirect demand still absorbs US long-end supply at a 5%+ post-Fed backdrop. The key isn’t the headline yield alone—it’s whether bid-cover holds while the tail (price concession) stays contained versus recent auctions, i.e., whether the “Fed put” is transmitting into auction clearing.

Fed Day Broke the Stock/Bond “Crash Cushion”—Because Inflation Risk and Real Rates Repriced Together
On Fed decision day (July 29, 2026), equities and Treasuries sold off in the same direction, not the usual hedge pattern. The move wasn’t just “rates stayed high”—it reflected a regime where inflation/risk premium and real-rate expectations rose together, weakening the diversification benefit long-duration Treasuries typically provide during growth scares.

Fed’s 9–3 “hawkish hold” turns internal dissent into a credibility premium for rates
When three voting regional presidents dissented in a 9–3 hold, it didn’t just change the policy path—it changed how markets price the next move. For investors, the actionable risk is not the hold itself, but that repeated visible dissent can widen the policy-risk premium and stress rate-sensitive earnings narratives—especially for banks whose income depends on the curve.

JPM: The first sell-side vote of confidence that makes “hawkish hold” the base case—December hike, not March-2027
J.P. Morgan Global Research moved its next Fed hike call to a quarter-point in December after the July hold, aligning with the hawkish-hold interpretation that Warsh signaled. For US banks, that timing shift matters most for NII sensitivity to the September path—and it changes how much “duration risk” the market is forced to price before year-end.

The “double-print” (PCE + Q2 GDP) is a single Fed test—because both prices and growth hit at 8:30 a.m.
Today’s BEA calendar stacks Personal Income and Outlays (June PCE) and GDP (Advance Estimate) (Q2) on the same 8:30 a.m. window, turning the usual macro routine into one all-in policy-input read. The market should treat the next 24 hours as a fork: core PCE cooling is what lets the Fed plausibly look through hot growth, while both running hot is what feeds a 30-year auction-driven duration selloff.

Mag-7 earnings are the first real “broadening” stress test—and the cap-weight is already doing the heavy lifting
The equal-weight S&P 500’s YTD lead suggests investors have been paying for “the average stock,” not just the largest tech complex. The first Mag-7 prints of the cycle (Meta and Microsoft) show why the divergence can flip: when leaders’ AI capex starts to pressure earnings quality, the cap-weight doesn’t just move with growth—it moves with expectations.
What to expect
Evidence-first notes with a visible point of view.
This section collects sharp takes on earnings, shareholder meetings, and market structure. Each new piece should make the thesis, the facts, and the implications obvious within the first few screens.
Expect direct analysis, not generic commentary.
Expect the data to be explicit and the argument to be easy to follow.
Plutux is not an investment adviser. Market data and AI-generated analysis are for information and education only, not investment advice. Disclaimer