Macro & Policy
Rates, inflation and the policy that moves them
Central bank decisions, jobs prints and fiscal policy, read the way a portfolio reads them: what reprices, by how much, and what would change the call.
2026-07-13
%22%2F%3E%0A%20%20%3Ccircle%20cx%3D%22220%22%20cy%3D%22150%22%20r%3D%22180%22%20fill%3D%22%2322d3ee%22%20fill-opacity%3D%220.12%22%2F%3E%0A%20%20%3Ccircle%20cx%3D%221010%22%20cy%3D%22130%22%20r%3D%22220%22%20fill%3D%22%2338bdf8%22%20fill-opacity%3D%220.08%22%2F%3E%0A%20%20%3Ccircle%20cx%3D%22920%22%20cy%3D%22520%22%20r%3D%22170%22%20fill%3D%22%2322d3ee%22%20fill-opacity%3D%220.06%22%2F%3E%0A%20%20%3Cpath%20d%3D%22M140%20430h920%22%20stroke%3D%22url(%23line)%22%20stroke-width%3D%2212%22%20stroke-linecap%3D%22round%22%2F%3E%0A%20%20%3Cpath%20d%3D%22M220%20360c120-150%20260-220%20380-220s260%2070%20380%20220%22%20fill%3D%22none%22%20stroke%3D%22%2367e8f9%22%20stroke-opacity%3D%220.5%22%20stroke-width%3D%2216%22%20stroke-linecap%3D%22round%22%20stroke-linejoin%3D%22round%22%2F%3E%0A%20%20%3Cpath%20d%3D%22M300%20398h600%22%20stroke%3D%22%2394a3b8%22%20stroke-opacity%3D%220.24%22%20stroke-width%3D%228%22%20stroke-linecap%3D%22round%22%2F%3E%0A%20%20%3Ctext%20x%3D%22220%22%20y%3D%22510%22%20fill%3D%22%23e2e8f0%22%20fill-opacity%3D%220.7%22%20font-family%3D%22Arial%2C%20Helvetica%2C%20sans-serif%22%20font-size%3D%2238%22%20letter-spacing%3D%228%22%3EINSIGHTS%3C%2Ftext%3E%0A%3C%2Fsvg%3E)

Citigroup's Remake Is Now an Earnings and Capital-Return Test
The bank is entering earnings with the cleanest restructuring story on Wall Street, but the market still wants proof that simplification turns into higher ROTCE, better fees, and more buybacks. The read-through matters for Citigroup, JPMorgan Chase, Bank of America, Goldman Sachs, and Wells Fargo.

The Strait of Hormuz Shock Is an Inflation Test Before It Is an Energy Trade
The latest U.S.-Iran escalation sent Brent and WTI higher, but the market consequence is broader than oil beta. If shipping risk persists, airlines, chemicals, retailers, and rate-sensitive growth all absorb a second-round inflation tax.

LNG Is Not Short Everywhere. It Is Becoming Scarce in the Wrong Places.
The latest LNG headlines show a market split into regional bottlenecks rather than one clean global price. Cheniere and other exporters can still benefit, but Europe, Asia, and gas-sensitive industries are paying the price of security risk and contract rigidity.

Paramount and Warner Bros. Discovery Are Being Repriced by Antitrust, Not Just Deal Math
The legal fight over the Paramount-Warner deal is no longer a merger-arbitrage footnote. With 12 states now trying to freeze the transaction, the market has to price regulatory duration, media concentration risk, and the possibility that content distribution gets revalued before the deal ever closes.
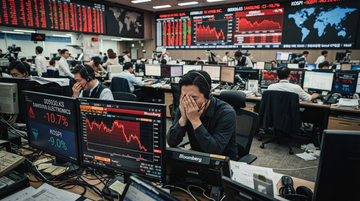
SK Hynix's 15% Crash Was a Liquidity Event, Not an AI Demand Reversal
The 15.4% plunge in SK Hynix and the 10.7% drop in Samsung Electronics looked like a thesis break, but the tape says leverage, geopolitical risk, and a cross-listing dislocation hit first. The deeper memory cycle is still tight, which means Seoul may be the weakest link even if the AI demand story stays intact.
2026-07-11

Apple's OpenAI Lawsuit Turns AI Hardware From a Growth Story Into a Trust Risk
Apple's lawsuit against OpenAI is more than a legal skirmish. It turns OpenAI's hardware ambitions into a trust and timeline problem, and it reminds investors that the next phase of AI competition is about supply-chain control, employee mobility, and who gets to own the device layer.
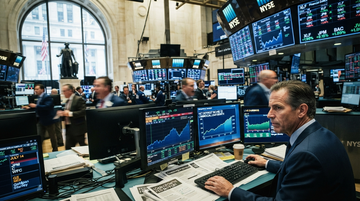
Bank Stocks Enter Earnings Season with the Fed Still on Their Side
Banks are rallying into Q2 earnings because capital markets are active, commercial loans are growing, and rates are still supportive of net interest income. The real risk is valuation, not the economy.

Canada Tariff Shock Reopens the Trade War Discount
A 35% tariff on many Canadian imports is not just a political headline. It is a tax on the most integrated bilateral supply chain in North America, and the market should price it as an inflation, margin, and FX event.

Canada's 35% Tariff Threat Reprices North American Trade
A 35% tariff on many Canadian imports is a direct hit to the North American supply chain. It pressures energy, autos, industrial margins, and eventually inflation.

The Dow Is a Price-Weighted Narrative Machine
The Dow is not a broad market map. It is a 30-stock, price-weighted signal that still matters because it is simple, durable, and culturally sticky.

Jobless Claims Tell the Market the Labor Market Is Cooling, Not Breaking
Initial claims at 215,000 and a 4-week average of 218,750 say the labor market is softening in a way that keeps the Fed patient, not panicked.

Meta's DSA Problem Reintroduces a Regulatory Discount to the Stock
The European Commission's preliminary DSA finding turns Meta's engagement design into a valuation issue, not just a compliance headline.

The Nasdaq Composite Is the Market's Innovation Thermometer
The Nasdaq Composite is broad, market-cap weighted, and still disproportionately driven by a small cluster of mega-cap innovators. That is why it reads like innovation beta rather than a plain stock list.

Why Oil's Drop Mattered More Than the Index Bounce
A one-day stock bounce matters less than the fact that oil, yields, and inflation pressure all cooled at once.
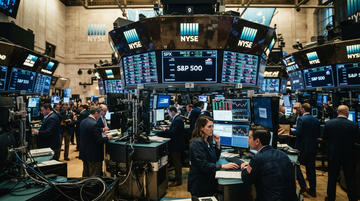
The S&P 500 Is the Market's Institutional Core
The S&P 500 is the benchmark that matters because it covers about 80% of available U.S. market capitalization, uses float-adjusted weighting, and sits at the center of passive and active portfolio construction.

SpaceX in the Nasdaq-100 Turned a Space Stock Into a Passive-Flow Test
SpaceX's inclusion in the Nasdaq-100 matters less as a space headline than as a test of how much passive capital can move a stock with tiny float and huge expectations.
2026-07-10

China's Helium Export Ban Turns a Niche Gas Into a Semiconductor and MRI Chokepoint
China's temporary helium export ban matters less because of absolute volume and more because helium sits at the wrong intersection of scarcity, specialty industry, and no-substitute physics. The read-through is broader than chips: MRI uptime, aerospace, and industrial gas pricing all get tighter when the marginal molecule disappears.

Commerce's UAE Export-Control Reset Reopens a Strategic Tech Corridor
BIS said it will significantly upgrade the UAE under the EAR, remove it from Country Groups D:3 and D:4, and reclassify it as A:5, enabling license-free exports, reexports, and in-country transfers for certain military items, satellites, spacecraft, and dual-use items relevant to oil, desalination, and civil nuclear power. The inference for investors is that U.S. semiconductor, defense, and systems vendors with Gulf exposure may face a friendlier export backdrop, including names like Nvidia and AMD as a policy read-through.

Risk-On Relief Rally: Why the Oil Drop Mattered More Than the Index Bounce
A deep dive into how easing oil prices, lower yield pressure, and calmer geopolitical headlines fed a broad risk-on move across U.S. equities.

Europe's Addictive-Design Case Puts Meta's Engagement Flywheel on Trial
The European Commission's preliminary DSA finding is not really about a fine. It is about whether Meta can keep maximizing session length, autoplay, and infinite scroll without changing the product architecture that drives ad yield.
What to expect
Evidence-first notes with a visible point of view.
This section collects sharp takes on earnings, shareholder meetings, and market structure. Each new piece should make the thesis, the facts, and the implications obvious within the first few screens.
Expect direct analysis, not generic commentary.
Expect the data to be explicit and the argument to be easy to follow.
Plutux is not an investment adviser. Market data and AI-generated analysis are for information and education only, not investment advice. Disclaimer