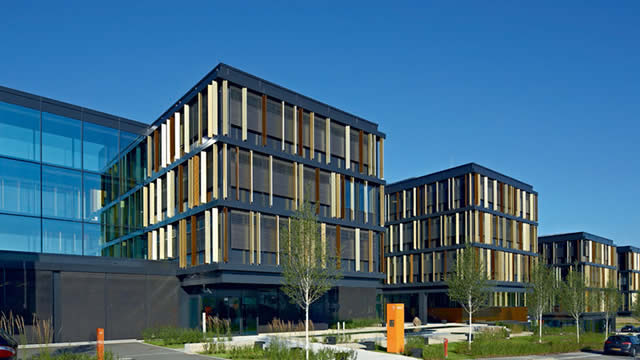
Rexford Industrial Realty, Inc. creates value by investing in, operating and repositioning industrial properties throughout infill Southern California, the world's fourth largest ...
Rexford Industrial Realty, Inc. (NYSE: REXR) is a leading real estate investment trust (REIT) focused on the acquisition, ownership, and operation of industrial properties in infill Southern California. As of the latest data, the company's portfolio comprises approximately 419 properties with about 51.2 million rentable square feet, serving a diverse ...Rexford Industrial Realty, Inc. (NYSE: REXR) is a leading real estate investment trust (REIT) focused on the acquisition, ownership, and operation of industrial properties in infill Southern California. As of the latest data, the company's portfolio comprises approximately 419 properties with about 51.2 million rentable square feet, serving a diverse tenant base. The company was incorporated in Maryland on January 18, 2013, and went public in July 2013. Founded in 2001 by Howard Schwimmer and Michael Frankel, Rexford has grown through a proprietary value-creation strategy that includes repositioning underutilized properties and enhancing their income-generating potential.
The company's business model emphasizes the high-barrier, supply-constrained nature of the Southern California industrial market, which has consistently demonstrated strong demand and low vacancy rates. This strategy enables both internal growth through active asset management and external growth via accretive acquisitions. Rexford's financial performance reflects its scale: with a market capitalization of approximately $8.4 billion, the company generates revenue from leasing space to a stable tenant base. The company's revenue per share over the trailing twelve months (TTM) is $4.40, and it has a dividend yield of about 4.7%, consistent with its REIT structure.
Key financial metrics show a gross profit margin of 61%, an operating profit margin of 39.6%, and a return on equity of -4.8% (due to non-cash impairments or unrealized losses), while its debt-to-equity ratio stands at 0.447, indicating a moderate leverage. The company's enterprise value is approximately $11.7 billion, with a price-to-sales ratio of 8.53. Rexford's leadership includes CEO Laura E. Clark, who has been with the company since its early days and took over as CEO in 2025. The company has about 256 employees and is a member of the S&P MidCap 400 Index.
Rexford is committed to sustainability, participating in programs like the U.S. Green Building Council and the Better Buildings Challenge, aiming to reduce energy and water consumption across its portfolio. With a strong presence in Los Angeles and other key Southern California submarkets, Rexford Industrial continues to capitalize on the region's industrial real estate dynamics, positioning itself for long-term growth and value creation for shareholders.
YoYYoY means Year-over-Year. It compares the latest annual value with the previous annual value to show long-term trend strength.
QoQQoQ means Quarter-over-Quarter. It compares the latest quarter with the immediately previous quarter to show short-term momentum changes.
RevenueThe total money that came through the front door from selling things, before paying a single bill. Think of it as the grand total of every credit card swipe from customers. (YoY compares this year to last year's performance, while QoQ compares the current three months to the previous three).
$1.0B
+7.1%
+0.2%
Net IncomeThe absolute bottom line. If the company paid every single supplier, employee, banker, and tax collector, this is the actual money left in their pocket at the end of the day.
$212.0M
-22.6%
-655.9%
Gross MarginThe basic markup. If they sell a $100 pair of sneakers, this percentage tells you how much of that price tag is profit right after paying for the rubber and shoelaces, but before paying for things like store rent or TV commercials.
+77.3%
-0.3%
+0.3%
Operating MarginThe 'day job' efficiency score. Out of every dollar a customer spends, this shows how many cents the company keeps after making the product AND paying for all the everyday corporate overhead (like salaries, marketing, and keeping the lights on).
+37.9%
-44.8%
+1.5%
Net MarginThe final take-home percentage. When you strip away every conceivable cost, tax, and interest payment, this is the exact number of cents the company truly gets to keep from every dollar in sales.
+21.1%
-27.7%
-654.9%
Free Cash FlowThe holy grail of corporate cash. It's the spendable, physical money left over after the business pays for its daily operations AND buys the big, expensive upgrades (like new factories or servers) it needs to survive. This is the 'free' money they can use to pay dividends or buy back stock.
$208.7M
+97.7%
-24.8%
FCF MarginThe ultimate cash conversion rate. It shows how good the company is at turning regular sales directly into cold, hard, spendable cash. A high percentage means the business is an absolute cash-printing machine.
+20.8%
+84.6%
-25.0%
Debt / EquityThe financial risk gauge. It compares how much of the company's empire was built using borrowed money (loans) versus the owners' own money (shareholders). A high number means they are heavily leveraged and playing a riskier game; a low number means they are playing it safe.
41.4%
+2.9%
+13.6%
Current RatioThe 12-month survival check. It simply compares the cash they have right now (plus things they can quickly turn into cash) against the immediate bills they absolutely must pay this year. A score above 1 means they have enough in the wallet to cover the upcoming bills without panicking.
7.16x
+761.3%
-71.0%
Total AssetsThe absolute size of the company's empire. It bundles together absolutely everything of value they own—from the cash in the register and the inventory in the warehouse, to the software patents in the vault and the factories on the ground.
Operator: Good morning. My name is Holly and I will be your conference operator today. At this time, I would like to welcome everyone to the Rexford Industrial Realty Inc second quarter 26 earnings call. All lines have been placed on mute to prevent any background noise. After the speakers remarks, there will be a Q&A session. If you would like to ask a question during this time, simply press star followed by the number 1 on your telephone keypad. If you would like to withdraw your question, press star 1 again. Thank you. I will now hand the call over to Mikayla Lynch senior vice president investor relations and capital markets at Rexford Industrial. Mikayla? Please go ahead.
Mikayla Lynch: Thank you, and welcome to Rexford Industrial's second quarter 26 earnings conference call. In addition to yesterday's earnings release, we posted a supplemental package and earnings presentation in the Investor Relations section on our website. To support today's remarks. As a reminder, management's remarks and responses to your questions may contain forward looking statements as defined by the federal security laws which are based on certain assumptions and subject to risks and uncertainties outlined in our 10 k and other SEC filings. As such, actual results may differ, and we assume no obligation to update any forward looking statements in the future. We will also discuss non GAAP financial measures on today's call. Our earnings presentation and supplemental package provide GAAP reconciliations as well as an explanation of why these measures are useful to investors. Joining me today are Rexford's CEO, Laura Elizabeth Clark together with our COO, John Nahas and our CFO, Mike Fitzmaurice. My pleasure to now introduce Laura Elizabeth Clark. Laura?
Laura Elizabeth Clark: Thank you, Mikayla, and thank you all for joining us today. The Rexford team delivered another quarter of strong execution. Leasing volume is up 50% year to date compared to this time last year, and we are raising core FFO per share guidance for the second consecutive quarter. We are also encouraged by improving fundamentals across the broader infill Southern California industrial market with increasing tenant demand driving positive net absorption and lower market vacancy. Our second quarter results reflect continued progress against the strategic priorities we laid out earlier this year. Opportunistic dispositions, accretive capital recycling, and operational rigor. We have moved with discipline, conviction, and speed. Taking meaningful action to position Rexford to deliver durable growth and shareholder value. Today, we are building on that momentum. By announcing a comprehensive portfolio realignment through the planned disposition of $2 billion of non core assets This is a pivotal and deliberate step. To further strengthen Rexford's portfolio enhance the quality and sustainability of our cash flows, and position the company to deliver outsized total shareholder returns. Over the first half …