EastGroup Properties, Inc. (NYSE: EGP), a self-administered equity real estate investment trust and an S&P MidCap 400 company, specializes in the development, ...
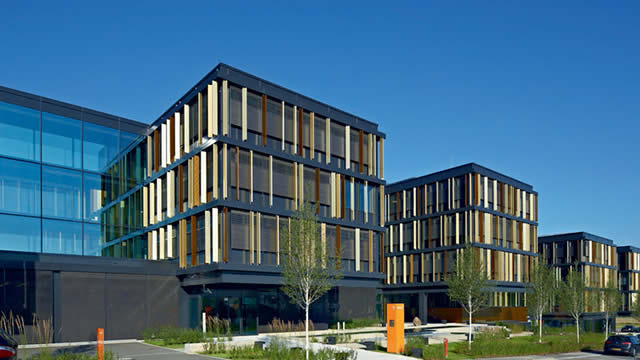
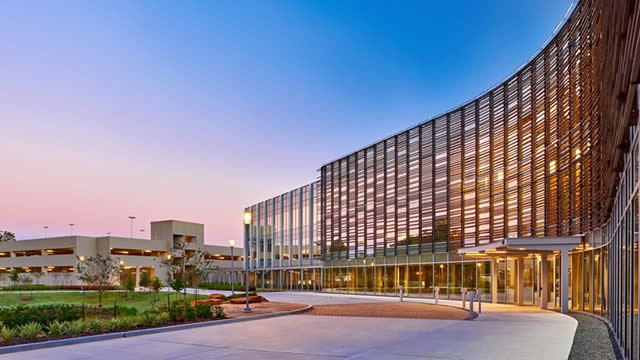
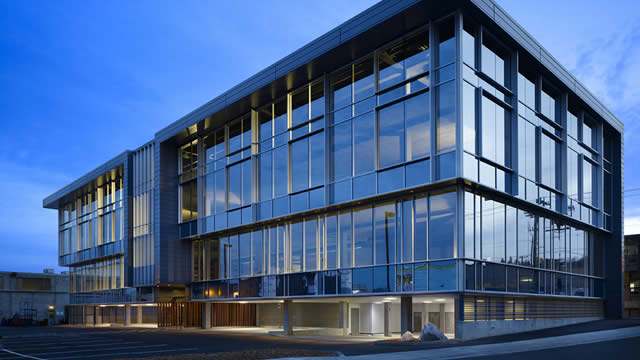
EastGroup Properties, Inc. (NYSE: EGP) is a self-administered equity real estate investment trust (REIT) that has been a prominent player in the industrial real estate sector since its incorporation in 1969. Headquartered in Ridgeland, Mississippi, the company is a member of the S&P MidCap 400 and Russell 2000 indexes, reflecting ...EastGroup Properties, Inc. (NYSE: EGP) is a self-administered equity real estate investment trust (REIT) that has been a prominent player in the industrial real estate sector since its incorporation in 1969. Headquartered in Ridgeland, Mississippi, the company is a member of the S&P MidCap 400 and Russell 2000 indexes, reflecting its established market presence. EastGroup focuses on the development, acquisition, and management of industrial properties, particularly multi-tenant business distribution buildings, which constitute approximately 91% of its portfolio. The company strategically targets high-growth Sunbelt markets, including Florida, Texas, Arizona, California, and North Carolina, where demand for distribution space is robust due to favorable demographics and economic growth. Its properties typically range from 15,000 to 70,000 square feet, catering to location-sensitive clients who require efficient and flexible spaces near key transportation networks. As of the latest data, the portfolio encompasses approximately 65.8 million square feet, including projects under development and value-add acquisitions. Financially, EastGroup has demonstrated solid performance, with a market capitalization of around $10.9 billion and a price-to-earnings ratio of 35.5, reflecting investor confidence. The company maintains a strong balance sheet with a debt-to-equity ratio of 0.467 and generates healthy cash flows, as indicated by an operating cash flow per share of $12.07. The leadership team, under CEO Marshall A. Loeb, who also serves as a director, has driven consistent growth, with record funds from operations in recent years. Key executives include President R. Reid Dunbar, CFO Staci H. Tyler, and EVPs Brent W. Wood and Michelle. EastGroup is committed to enhancing shareholder value through a disciplined growth strategy that emphasizes ownership of prime distribution centers in supply-constrained submarkets. The company also prioritizes sustainability and community engagement, aiming to create long-term value for investors and stakeholders alike.
YoYYoY means Year-over-Year. It compares the latest annual value with the previous annual value to show long-term trend strength.
QoQQoQ means Quarter-over-Quarter. It compares the latest quarter with the immediately previous quarter to show short-term momentum changes.
RevenueThe total money that came through the front door from selling things, before paying a single bill. Think of it as the grand total of every credit card swipe from customers. (YoY compares this year to last year's performance, while QoQ compares the current three months to the previous three).
$721.3M
+13.0%
+1.6%
Net IncomeThe absolute bottom line. If the company paid every single supplier, employee, banker, and tax collector, this is the actual money left in their pocket at the end of the day.
$257.4M
+13.0%
-20.2%
Gross MarginThe basic markup. If they sell a $100 pair of sneakers, this percentage tells you how much of that price tag is profit right after paying for the rubber and shoelaces, but before paying for things like store rent or TV commercials.
+43.3%
-40.4%
+388.5%
Operating MarginThe 'day job' efficiency score. Out of every dollar a customer spends, this shows how many cents the company keeps after making the product AND paying for all the everyday corporate overhead (like salaries, marketing, and keeping the lights on).
+39.9%
-42.5%
+1.5%
Net MarginThe final take-home percentage. When you strip away every conceivable cost, tax, and interest payment, this is the exact number of cents the company truly gets to keep from every dollar in sales.
+35.7%
+0.0%
-21.5%
Free Cash FlowThe holy grail of corporate cash. It's the spendable, physical money left over after the business pays for its daily operations AND buys the big, expensive upgrades (like new factories or servers) it needs to survive. This is the 'free' money they can use to pay dividends or buy back stock.
$404.9M
+13.3%
-40.3%
FCF MarginThe ultimate cash conversion rate. It shows how good the company is at turning regular sales directly into cold, hard, spendable cash. A high percentage means the business is an absolute cash-printing machine.
+56.1%
+0.3%
-41.2%
Debt / EquityThe financial risk gauge. It compares how much of the company's empire was built using borrowed money (loans) versus the owners' own money (shareholders). A high number means they are heavily leveraged and playing a riskier game; a low number means they are playing it safe.
50.1%
+6.7%
-0.0%
Current RatioThe 12-month survival check. It simply compares the cash they have right now (plus things they can quickly turn into cash) against the immediate bills they absolutely must pay this year. A score above 1 means they have enough in the wallet to cover the upcoming bills without panicking.
0.85x
+14.2%
+10.9%
Total AssetsThe absolute size of the company's empire. It bundles together absolutely everything of value they own—from the cash in the register and the inventory in the warehouse, to the software patents in the vault and the factories on the ground.
Operator : Good morning, ladies and gentlemen, and welcome to the EastGroup Properties Second Quarter 2026 Conference Call and Webcast Conference Call. [Operator Instructions] This call is being recorded on Thursday, July 23, 2026. I would now like to turn the conference over to Marshall Loeb, the CEO. Please go ahead.
Marshall Loeb : Good morning, and thanks for calling in for our second quarter 2026 conference call. As always, we appreciate your interest. I'm happy to say that joining me on this morning's call are Reid Dunbar, our President; Staci Tyler, our CFO; and Brent Wood, our COO. Since we'll make forward-looking statements, we ask that you listen to the following disclaimer.
Casey Edgecombe : Please note that our conference call today will contain financial measures such as PNOI and FFO that are non-GAAP measures as defined in Regulation G. Please refer to our most recent financial supplement and our earnings press release, both available on the Investor page of our website and to our periodic reports furnished or filed with the SEC for definitions and further information regarding our use of these non-GAAP financial measures and a reconciliation of them to our GAAP results. Please also note that some statements during this call are forward-looking statements as defined in and within the safe harbors under the Securities Act of 1933, the Securities Act of 1934 and the Private Securities Litigation Reform Act of 1995. Forward-looking statements in the earnings press release along with our remarks are made as of today and reflect our current views of the company's plans, intentions, expectations, strategies and prospects based on the information currently available to the company and on assumptions it is made. We undertake no duty to update such statements or remarks, whether as a result of new information, future or actual events or otherwise. Such statements involve known and unknown risks, uncertainties and other factors that may cause actual results to differ materially. Please see our SEC filings, including our most recent annual report on Form 10-K for more details about these risks.
Marshall Loeb : Good morning. I'll start by congratulating our team. We had a strong quarter as well as first half of the year. I'm proud of the results achieved. Our quarterly results demonstrate our portfolio quality and strength within the industrial markets. Some of the stats produced include, funds from operation were $2.36 per share, up $0.02 above our guidance midpoint and up 6.8% quarter-over-quarter. Year-to-date FFO per share is up 7.6%. For over a decade now, our quarterly FFO per share has exceeded the FFO per share reported in the same quarter of prior year, truly a long-term growth trend. Quarter-end leasing was 96.8%, with occupancy at 95.6%. Average quarterly occupancy was 95.6%, which was down 30 basis points from second quarter 2025. Also notable was quarter-end same-store occupancy at 96.9%. Quarterly re-leasing spreads were …