Modiv Industrial, Inc. is an internally managed REIT that is focused on single-tenant net-lease industrial manufacturing real estate. The Company actively acquires ...
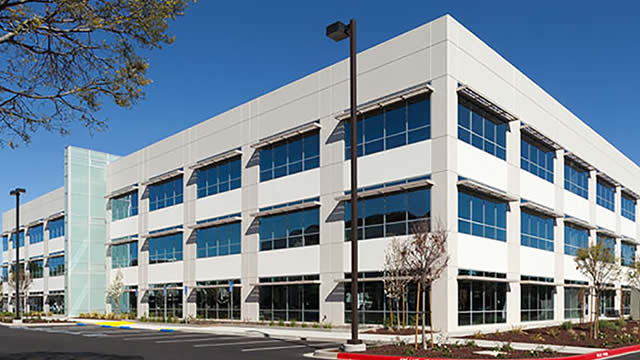
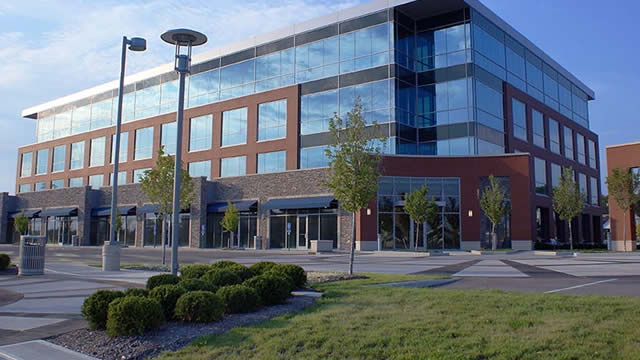
Modiv Industrial, Inc. (NYSE: MDV) is a real estate investment trust (REIT) that operates as an internally managed platform focused on industrial manufacturing real estate. Unlike diversified landlords, its core specialization is acquiring and managing single-tenant properties structured as net leases (i.e., the tenant bears substantially all or significant portions ...Modiv Industrial, Inc. (NYSE: MDV) is a real estate investment trust (REIT) that operates as an internally managed platform focused on industrial manufacturing real estate. Unlike diversified landlords, its core specialization is acquiring and managing single-tenant properties structured as net leases (i.e., the tenant bears substantially all or significant portions of property operating costs). This structure can provide more predictable property-level cash flows because lease economics are tied to long-term tenant operations rather than fragmented tenant occupancy.
Business model and what it “sells”: While Modiv does not sell consumer products, it “provides” income-producing real estate exposure to investors through a portfolio of industrial manufacturing facilities leased to tenants. The company actively seeks properties it considers important to U.S. supply chains—assets where tenant demand is supported by manufacturing needs and long-term operational requirements. Operationally, Modiv’s internal management team handles acquisition sourcing, property oversight, and portfolio management, which can reduce reliance on external asset-management fees compared with externally managed REIT structures.
Capital deployment and costs (conceptual BOM): Because it is a REIT, its cost structure differs from a manufacturing business—there is no bill of materials (BOM). Instead, “inputs” to returns include property acquisition costs (purchase price and transaction expenses), ongoing property operating expenses (typically partly borne by tenants under net lease terms), maintenance/capex needs, debt service (where applicable), and corporate overhead. The company’s capital allocation decisions—especially financing mix and reinvestment pace—drive returns alongside lease renewals, tenant credit, and property performance.
Financial and performance perspective: From the provided snapshot, Modiv’s market capitalization is about $186.3M and its beta is slightly negative (around -0.08), suggesting low relative price volatility vs. the broader market in the provided data. The company pays a dividend (dividend yield shown around ~6.6% in the snapshot), and its REIT economics are closely tied to cash flows from the property portfolio. Several valuation metrics are provided (e.g., price-to-book around 1.16 and price-to-sales around ~4.05), which are commonly used by investors to compare market expectations for growth and earnings power.
Key people: The CEO and President is Aaron S. Halfacre. The source also indicates other senior executives such as Dave Collins (Chief Property Officer) and Raymond J. Pacini (Executive Vice President), reflecting a leadership structure focused on property and corporate execution.
Company history and evolution: The company traces its legacy to being incorporated in 2015 in Maryland and has undergone corporate evolution and branding changes over time, including becoming Modiv Inc. effective February 1, 2021 and operating under the Modiv Industrial name later (as reflected in the provided context).
Investor intent and “wishes”: The stated aim in investor-facing coverage is to generate consistent current income and long-term capital appreciation. Practically, this translates into efforts to (1) acquire/retain quality industrial assets with long leases, (2) manage tenant and lease risk, (3) maintain manageable leverage and liquidity, and (4) sustain dividend capacity through portfolio cash flow and disciplined reinvestment.
YoYYoY means Year-over-Year. It compares the latest annual value with the previous annual value to show long-term trend strength.
QoQQoQ means Quarter-over-Quarter. It compares the latest quarter with the immediately previous quarter to show short-term momentum changes.
RevenueThe total money that came through the front door from selling things, before paying a single bill. Think of it as the grand total of every credit card swipe from customers. (YoY compares this year to last year's performance, while QoQ compares the current three months to the previous three).
$46.4M
-0.8%
-0.1%
Net IncomeThe absolute bottom line. If the company paid every single supplier, employee, banker, and tax collector, this is the actual money left in their pocket at the end of the day.
$1.1M
-82.3%
+7554.0%
Gross MarginThe basic markup. If they sell a $100 pair of sneakers, this percentage tells you how much of that price tag is profit right after paying for the rubber and shoelaces, but before paying for things like store rent or TV commercials.
+27.5%
-70.2%
+0.7%
Operating MarginThe 'day job' efficiency score. Out of every dollar a customer spends, this shows how many cents the company keeps after making the product AND paying for all the everyday corporate overhead (like salaries, marketing, and keeping the lights on).
+34.3%
-26.9%
+137.6%
Net MarginThe final take-home percentage. When you strip away every conceivable cost, tax, and interest payment, this is the exact number of cents the company truly gets to keep from every dollar in sales.
+2.3%
-82.1%
+7559.8%
Free Cash FlowThe holy grail of corporate cash. It's the spendable, physical money left over after the business pays for its daily operations AND buys the big, expensive upgrades (like new factories or servers) it needs to survive. This is the 'free' money they can use to pay dividends or buy back stock.
$14.5M
-20.7%
-12.1%
FCF MarginThe ultimate cash conversion rate. It shows how good the company is at turning regular sales directly into cold, hard, spendable cash. A high percentage means the business is an absolute cash-printing machine.
+31.2%
-20.1%
-12.1%
Debt / EquityThe financial risk gauge. It compares how much of the company's empire was built using borrowed money (loans) versus the owners' own money (shareholders). A high number means they are heavily leveraged and playing a riskier game; a low number means they are playing it safe.
165.0%
+12.1%
-3.6%
Current RatioThe 12-month survival check. It simply compares the cash they have right now (plus things they can quickly turn into cash) against the immediate bills they absolutely must pay this year. A score above 1 means they have enough in the wallet to cover the upcoming bills without panicking.
53.46x
+25927.5%
-65.4%
Total AssetsThe absolute size of the company's empire. It bundles together absolutely everything of value they own—from the cash in the register and the inventory in the warehouse, to the software patents in the vault and the factories on the ground.
Operator: Good day, and welcome to Modiv Industrial, Inc. Fourth Quarter 2025 Conference Call. [Operator Instructions] On today's call, management will provide remarks and then we will open up the call for your questions. [Operator Instructions] Please note this event is being recorded. And I would now like to turn the conference over to Sara Grisham, Chief Accounting Officer. Please go ahead.
Sara Grisham: Thank you, operator, and thank you, everyone, for joining us for Modiv Industrial's Fourth Quarter and Full Year 2025 Earnings Call. We issued our earnings release after market close today, and it's available on our website at modiv.com. I'm here today with Aaron Halfacre, Chief Executive Officer; Ray Pacini, Chief Financial Officer; and John Raney, Chief Operating Officer and General Counsel. Before we begin, I would like to remind you that today's comments will include forward-looking statements under the federal securities laws. Forward-looking statements are identified by words such as will, be, intend, believe, expect, anticipate or other comparable words or phrases. Statements that are not historical facts, such as statements about our expected acquisitions and dispositions and business plans are also forward-looking statements. Our actual financial condition and results of operations may vary materially from those contemplated by such forward-looking statements. Discussion of the factors that could cause our results to differ materially from these forward-looking statements are contained in our SEC filings, including our reports on Form 10-K and 10-Q. With that, I would like to turn the call over to Aaron. Aaron, please go ahead.
Aaron Halfacre: Thanks, Sara. Hello, everyone. I hope you're doing well. Crazy times. So I know I'm looking forward to this call. I'm sure you are, too. Let me start off by saying that Sara just read the standard preamble that everyone has that talks about forward-looking statements. And I spend the vast majority of my time thinking about forward things. But the historical things and the things that are measured, the accounting are really important. And I just -- this is a point in time because this is going to be Ray's last earnings call, even though Ray is going to be with us for the remainder of the year, it's his last official earnings call, and John is going to be taking over the helm. And I just really want to speak and thank our team. So Sara, John, Winnie, Lamont, Jason, all the accounting team, in particular, which is candidly more than half of our company, does such a good job and they make my job easier so I can spend all this time talking about the forward thinking things and dealing with these things that don't always have measurable outcomes. And that messy part of it that I do is that much easier because of how good they are. So I appreciate that they're all here and just wanted to welcome Sara to the call, even though she's always been there in the background, she's going to be part of the call …