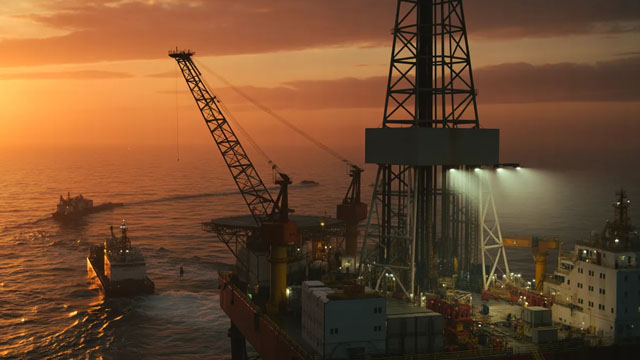
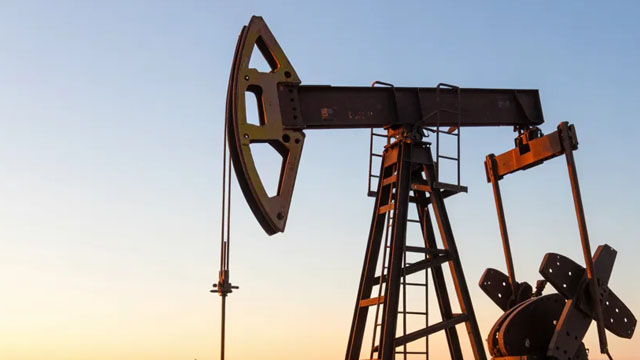
Obsidian Energy Ltd. (NYSE Arca: OBE) is an intermediate Canadian upstream oil and gas producer headquartered in Calgary, Alberta, with operations centered on the Western Canada Sedimentary Basin (WCSB). The company’s core activities are the discovery, extraction, and enhancement of crude oil and natural gas resources, with a business model ...Obsidian Energy Ltd. (NYSE Arca: OBE) is an intermediate Canadian upstream oil and gas producer headquartered in Calgary, Alberta, with operations centered on the Western Canada Sedimentary Basin (WCSB). The company’s core activities are the discovery, extraction, and enhancement of crude oil and natural gas resources, with a business model typical of E&P companies: acquire or hold petroleum interests, drill and complete wells, operate production assets, and continually optimize reservoir performance through maintenance, workovers, and development planning.
From a products and service perspective, Obsidian Energy’s “products” are the sale of crude oil, natural gas, and associated natural gas liquids produced from its operated and non-operated properties (as is common in the WCSB). Its value creation generally depends on converting subsurface assets into sustained production—then lowering unit costs through operational efficiency. Like many upstream firms, much of the company’s cost structure is driven by lease operating costs, field services, well servicing/workover activity, transportation and gathering, and regulatory/compliance expenses. Capital expenditure (capex) typically represents the largest controllable lever in the short to medium term, supporting drilling programs, development projects, and infrastructure required to bring production online.
Financially, upstream businesses are highly sensitive to commodity prices and operating volumes, and they often require disciplined capital allocation. Metrics provided indicate an E&P company with exposure to market cycles (e.g., valuation multiples and cash-flow relationships) and a working-capital profile that may fluctuate with commodity pricing, receivables, and payment terms. Such companies also manage balance-sheet risk through funding of capital programs, debt management, and maintaining liquidity to withstand lower-price periods.
Key people include Stephen Elias Loukas, President and Chief Executive Officer (appointed in 2022, with prior interim leadership roles). The corporate lineage includes a notable rebranding: formerly known as Penn West Petroleum Ltd., the firm adopted the Obsidian Energy name in June 2017. Governance and strategy are typically focused on: (1) portfolio management within the WCSB, (2) sustaining and growing production in a risk-managed way, and (3) improving returns through operational optimization and targeted development.
Operationally, staffing levels (around the low-to-mid hundreds in recent years) suggest a lean organizational approach for an upstream producer—balancing technical expertise in geology/reservoir engineering and field operations with cost control. Over time, Obsidian also emphasizes recruiting and workplace recognition in Alberta, reflecting a focus on attracting skilled talent to support field execution and asset stewardship.
YoYYoY means Year-over-Year. It compares the latest annual value with the previous annual value to show long-term trend strength.
QoQQoQ means Quarter-over-Quarter. It compares the latest quarter with the immediately previous quarter to show short-term momentum changes.
RevenueThe total money that came through the front door from selling things, before paying a single bill. Think of it as the grand total of every credit card swipe from customers. (YoY compares this year to last year's performance, while QoQ compares the current three months to the previous three).
$393.8M
-22.5%
+24.5%
Net IncomeThe absolute bottom line. If the company paid every single supplier, employee, banker, and tax collector, this is the actual money left in their pocket at the end of the day.
$25.6M
+118.2%
+319.9%
Gross MarginThe basic markup. If they sell a $100 pair of sneakers, this percentage tells you how much of that price tag is profit right after paying for the rubber and shoelaces, but before paying for things like store rent or TV commercials.
+20.0%
-24.7%
+59.7%
Operating MarginThe 'day job' efficiency score. Out of every dollar a customer spends, this shows how many cents the company keeps after making the product AND paying for all the everyday corporate overhead (like salaries, marketing, and keeping the lights on).
+14.1%
-38.0%
+53.3%
Net MarginThe final take-home percentage. When you strip away every conceivable cost, tax, and interest payment, this is the exact number of cents the company truly gets to keep from every dollar in sales.
+6.5%
+123.5%
+276.6%
Free Cash FlowThe holy grail of corporate cash. It's the spendable, physical money left over after the business pays for its daily operations AND buys the big, expensive upgrades (like new factories or servers) it needs to survive. This is the 'free' money they can use to pay dividends or buy back stock.
$-59.4M
+8.0%
-144.9%
FCF MarginThe ultimate cash conversion rate. It shows how good the company is at turning regular sales directly into cold, hard, spendable cash. A high percentage means the business is an absolute cash-printing machine.
-15.1%
-18.6%
-96.7%
Debt / EquityThe financial risk gauge. It compares how much of the company's empire was built using borrowed money (loans) versus the owners' own money (shareholders). A high number means they are heavily leveraged and playing a riskier game; a low number means they are playing it safe.
14.4%
-41.1%
+37.2%
Current RatioThe 12-month survival check. It simply compares the cash they have right now (plus things they can quickly turn into cash) against the immediate bills they absolutely must pay this year. A score above 1 means they have enough in the wallet to cover the upcoming bills without panicking.
0.54x
-69.9%
+35.8%
Total AssetsThe absolute size of the company's empire. It bundles together absolutely everything of value they own—from the cash in the register and the inventory in the warehouse, to the software patents in the vault and the factories on the ground.