Zacks Investment Research8/12/2026Neutral
Permian Resources Beats Q2 Earnings on Strong Price Realizations
PR's Q2 earnings beat estimates as stronger oil and NGL price realizations boost sales and earnings, while 2026 oil guidance rises.
Permian Resources Corporation operates as an independent producer in the oil and natural gas sector, primarily concentrating its efforts on the extraction ...
Plutux is not an investment adviser. Market data and AI-generated analysis are for information and education only, not investment advice. Disclaimer
$0.62 per share
$0.62 per share
Est. EPS $0.55 · Revenue $1.67B · 11 analysts
Est. EPS $0.57 · Revenue $1.72B · 11 analysts
| Metric | Latest | YoYYoY means Year-over-Year. It compares the latest annual value with the previous annual value to show long-term trend strength. | QoQQoQ means Quarter-over-Quarter. It compares the latest quarter with the immediately previous quarter to show short-term momentum changes. |
|---|---|---|---|
| RevenueThe total money that came through the front door from selling things, before paying a single bill. Think of it as the grand total of every credit card swipe from customers. (YoY compares this year to last year's performance, while QoQ compares the current three months to the previous three). | $5.1B | +1.3% | +33.9% |
| Net IncomeThe absolute bottom line. If the company paid every single supplier, employee, banker, and tax collector, this is the actual money left in their pocket at the end of the day. | $935.2M | -5.0% | +1716.7% |
| Gross MarginThe basic markup. If they sell a $100 pair of sneakers, this percentage tells you how much of that price tag is profit right after paying for the rubber and shoelaces, but before paying for things like store rent or TV commercials. | +32.7% | -30.5% | +79.8% |
| Operating MarginThe 'day job' efficiency score. Out of every dollar a customer spends, this shows how many cents the company keeps after making the product AND paying for all the everyday corporate overhead (like salaries, marketing, and keeping the lights on). | +29.0% | -16.8% | +21.5% |
| Net MarginThe final take-home percentage. When you strip away every conceivable cost, tax, and interest payment, this is the exact number of cents the company truly gets to keep from every dollar in sales. | +18.5% | -6.2% | +1257.3% |
| Free Cash FlowThe holy grail of corporate cash. It's the spendable, physical money left over after the business pays for its daily operations AND buys the big, expensive upgrades (like new factories or servers) it needs to survive. This is the 'free' money they can use to pay dividends or buy back stock. | $557.4M | +91.3% | +738.6% |
| FCF MarginThe ultimate cash conversion rate. It shows how good the company is at turning regular sales directly into cold, hard, spendable cash. A high percentage means the business is an absolute cash-printing machine. | +11.0% | +88.9% | +526.5% |
| Debt / EquityThe financial risk gauge. It compares how much of the company's empire was built using borrowed money (loans) versus the owners' own money (shareholders). A high number means they are heavily leveraged and playing a riskier game; a low number means they are playing it safe. | 36.0% | -23.7% | -20.1% |
| Current RatioThe 12-month survival check. It simply compares the cash they have right now (plus things they can quickly turn into cash) against the immediate bills they absolutely must pay this year. A score above 1 means they have enough in the wallet to cover the upcoming bills without panicking. | 0.78x | -7.4% | -4.7% |
| Total AssetsThe absolute size of the company's empire. It bundles together absolutely everything of value they own—from the cash in the register and the inventory in the warehouse, to the software patents in the vault and the factories on the ground. | $18.2B | +7.9% | +2.8% |
| Metric | Annual (A vs E) | Annual Surprise | Quarter (A vs E) | Quarter Surprise |
|---|---|---|---|---|
| EPS Surprise | 1.28 vs 1.16 | +10.4% | 0.93 vs 0.55 | +69.3% |
| Revenue Surprise | $5.1B vs $5.2B | -3.4% | $1.9B vs $1.7B | +11.0% |
| Date | Executive | Title | Security | Side | Shares | Price |
|---|---|---|---|---|---|---|
| Sep 3, 2026 | Oliphint Guy M | officer: EVP, Chief Financial Officer | Class A Common Stock | D | 5,103 | $23.75 |
| Sep 3, 2026 | Shannon Robert Regan | officer: EVP, Chief Accounting Officer | Class A Common Stock | D | 5,104 | $23.75 |
| Sep 3, 2026 | Bell John Charles | officer: EVP, General Counsel | Class A Common Stock | D | 5,492 | $23.75 |
| Sep 1, 2026 | Oliphint Guy M | officer: EVP, Chief Financial Officer | Restricted Stock Unit | A | 24,306 | — |
| Sep 1, 2026 | Shannon Robert Regan | officer: EVP, Chief Accounting Officer | Restricted Stock Unit | A | 24,306 | — |
Operator: Good morning, and welcome to Permian Resources conference call to discuss its second quarter 2026 earnings. Today's call is being recorded. A replay of the call will be available by visiting the company's website at www.permianres.com. At this time, I will now turn the call over to Hays Mabry, Permian Resources Vice President of Investor Relations, for some opening remarks. Please go ahead. Hays Mabry: Thanks, Eldi, and thank you all for joining us. On the call today are Will Hickey and James Walter, our Chief Executive Officers; and Guy Oliphint, our Chief Financial Officer. Many of the comments during this call are forward-looking statements that involve risks and uncertainties that could affect our actual results and are discussed in more detail in our filings with the SEC. We may also refer to non-GAAP financial measures. For any non-GAAP measure we use, a reconciliation to the nearest corresponding GAAP measure can be found in our earnings release or presentation. With that, I will turn the call over to Will Hickey, Co-CEO. William Hickey: Thanks, Hays. Q2 is a standout quarter for Permian Resources. We delivered record free cash flow of $751 million, an increase of almost 50% quarter-over-quarter and record free cash flow per share of $0.88. These results reflect our team's ability to respond quickly and decisively to a volatile commodity environment. Our activities this quarter are a reminder of the uniqueness of PR's business model. We can respond quickly to market conditions. We have a differentiated approach to sourcing and executing acquisitions, and we are relentlessly improving the capital efficiency of our business on a go-forward basis. All of these characteristics support the goal we are all aligned on, increasing free cash flow per share over the long term to create shareholder value. Turning to the quarter. Oil production came in at approximately 198,000 barrels per day, up 3% quarter-over-quarter. Slide 4 shows the key drivers that drove that oil production growth. When oil prices moved higher, our team in the field responded immediately. We increased the number of workover rigs by 50%, which improved run times and quickly accelerated incremental barrels. At the same time, our successful ground game drove working interest in completed wells to approximately 82% for the quarter, up materially from our original expectations of 75%. Combined with strong well performance, these actions generated 6,000 barrels per day of oil growth quarter-over-quarter for cash capital expenditures of $521 million. One thing I'd highlight is our continued success in increasing working interest ahead of development. This has always been part of the PR playbook, but our BD and land team have executed at an exceptionally high level this year. We view these acquisitions as some of the highest rate of return deals that we do, given that their near-term impact as evidenced from our higher working interest not only in Q2, but also for the …
| Name | Title | Compensation | Gender | Year Born | Status |
|---|---|---|---|---|---|
Guy Oliphint | Executive Vice President & Chief Financial Officer | USD 1,202,009 | Male | 1980 | Active |
Robert Shannon | Executive Vice President & Chief Accounting Officer | USD 899,333 | Male | 1990 | Active |
John C. Bell | Executive VP, General Counsel & Secretary | USD 895,275 | Male | 1986 | Active |
James H. Walter | Co-CEO & Director | — | Male | 1988 | Active |
William Hickey | Co-CEO & Director | — | Male | 1987 | Active |
Will Ellison | Vice President of Marketing & Midstream | — | Male | — | Active |
Charles Osborn | Vice President & Chief Information Officer | — | Male | — | Active |
Ryan Gitomer | Senior Vice President of Finance & Corporate Development | — | Male | — | Active |
Michelle Collette | Vice President of Human Resources | — | Female | — | Active |
Hays Mabry | Vice President of Investor Relations | — | Male | — | Active |
PR's Q2 earnings beat estimates as stronger oil and NGL price realizations boost sales and earnings, while 2026 oil guidance rises.
The Zacks Style Scores offers investors a way to easily find top-rated stocks based on their investing style. Here's why you should take advantage.
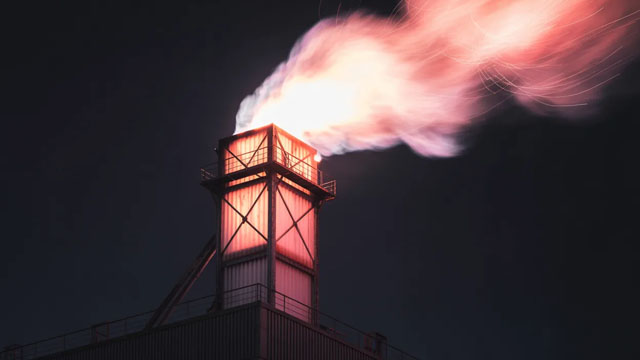
Permian Resources (PR) continues its rollup strategy by acquiring small bolt-on assets at significant discounts. PR's disciplined approach has resulted in average acquisition costs of $13K per acre, compared to competitors paying up to $65K. PR has executed nearly 200 small transactions. As a result, PR has built significant contiguous blocks that are more valuable.
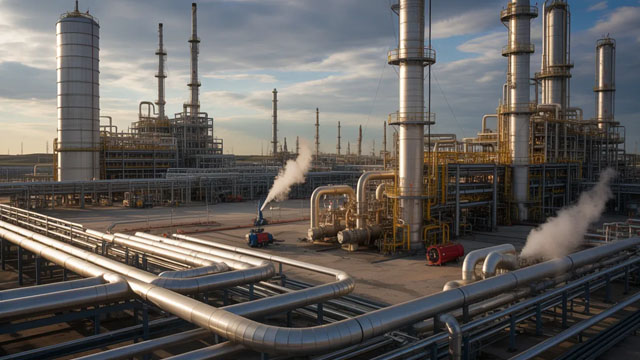
Permian Resources NYSE: PR reported record second-quarter free cash flow of $751 million, or $0.88 per share, as higher oil production, increased working interests in completed wells and a rapid response to commodity-price movements supported results.
Permian Resources demonstrates premium operator quality with strong Q2 free cash flow, oil production growth, and disciplined bolt-on acquisitions. Q2 adjusted free cash flow surged to $751 million, with oil production up 3% sequentially, while management actively managed Waha gas price risk. PR's balance sheet strengthened, reducing debt by 35% in 2024 and achieving 0.5x leverage, enhancing flexibility for dividends, further deleveraging, or acquisitions.