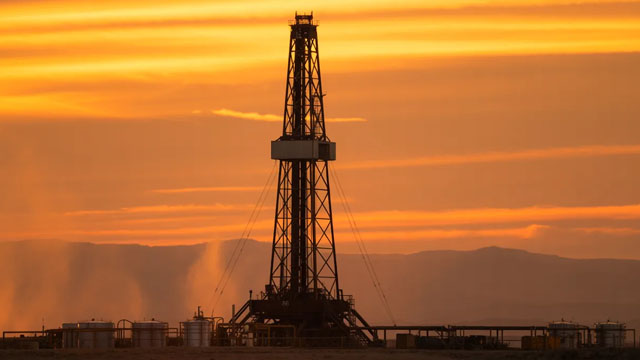
Tamboran Resources Corporation is an Australian-focused natural gas exploration and development company founded in 2009 and headquartered in Sydney, New South Wales. The company became publicly listed on the New York Stock Exchange under the symbol TBN in June 2024. Its central business objective is to develop unconventional natural gas ...Tamboran Resources Corporation is an Australian-focused natural gas exploration and development company founded in 2009 and headquartered in Sydney, New South Wales. The company became publicly listed on the New York Stock Exchange under the symbol TBN in June 2024. Its central business objective is to develop unconventional natural gas resources in the Beetaloo Basin in Australia's Northern Territory and supply gas into markets that may require reliable energy during the transition toward lower-carbon power systems. Tamboran presents natural gas as a complement to renewable energy, particularly where grid reliability, industrial demand, and energy security require dispatchable fuel.
The company's asset portfolio is concentrated in the Beetaloo Basin. It holds a 25% non-operated interest in EP 161, a 38.75% equity interest across EPs 76, 98, and 117, and 100% interests in EPs 136, 143, and EP(A) 197. These permits provide exposure to a large unconventional gas resource base, but they also require further appraisal, drilling, infrastructure development, regulatory approvals, and commercial contracting before they can generate sustained production revenue. The company has emphasized the goal of progressing toward first gas and commercial-scale development rather than operating as a mature, high-volume producer.
Its products and potential services are centered on natural gas exploration, appraisal, development, production, and related project management. At this stage, the principal cost drivers are geological and geophysical studies, drilling and completion activities, well testing, field infrastructure, gathering and processing systems, permitting, environmental compliance, personnel, and corporate administration. A conventional bill of materials is not publicly applicable in the same way as it would be for a manufacturing company; instead, project inputs include drilling rigs, tubulars, fracturing equipment, engineering services, land access, transportation, processing equipment, and pipeline or other midstream capacity. Costs can increase materially with drilling complexity, infrastructure requirements, regulatory conditions, and delays.
The supplied trailing financial indicators show a development-stage profile. Revenue and profitability margins are reported at zero, while free cash flow, operating cash flow, return on assets, and return on equity are negative. Trailing free cash flow to equity is approximately negative $204.5 million, and free cash flow to the firm is approximately negative $195.1 million, reflecting substantial investment relative to current operating inflows. The company reports a current ratio of about 2.0 and debt-to-equity of approximately 0.17, suggesting liquidity and leverage should be evaluated alongside the capital required to advance its projects. It does not currently pay a dividend.
Tamboran is led by CEO Todd C. Abbott, an energy executive with experience in the United States shale industry, including roles associated with Pioneer Natural Resources, Seneca Resources, and Marathon Oil. With approximately 46 full-time employees, the company operates as a relatively small specialist exploration and development organization. Key strategic priorities include proving resource quality, achieving safe and economic production, securing infrastructure and customers, obtaining regulatory approvals, managing capital efficiently, and delivering its stated lower-emissions development model. Principal risks include exploration results, commodity prices, financing needs, execution, environmental and regulatory requirements, land and community considerations, infrastructure availability, and the timing of first commercial gas.
YoYYoY means Year-over-Year. It compares the latest annual value with the previous annual value to show long-term trend strength.
QoQQoQ means Quarter-over-Quarter. It compares the latest quarter with the immediately previous quarter to show short-term momentum changes.
RevenueThe total money that came through the front door from selling things, before paying a single bill. Think of it as the grand total of every credit card swipe from customers. (YoY compares this year to last year's performance, while QoQ compares the current three months to the previous three).
$0
—
—
Net IncomeThe absolute bottom line. If the company paid every single supplier, employee, banker, and tax collector, this is the actual money left in their pocket at the end of the day.
$-36.9M
-68.4%
-42.3%
Gross MarginThe basic markup. If they sell a $100 pair of sneakers, this percentage tells you how much of that price tag is profit right after paying for the rubber and shoelaces, but before paying for things like store rent or TV commercials.
—
—
—
Operating MarginThe 'day job' efficiency score. Out of every dollar a customer spends, this shows how many cents the company keeps after making the product AND paying for all the everyday corporate overhead (like salaries, marketing, and keeping the lights on).
—
—
—
Net MarginThe final take-home percentage. When you strip away every conceivable cost, tax, and interest payment, this is the exact number of cents the company truly gets to keep from every dollar in sales.
—
—
—
Free Cash FlowThe holy grail of corporate cash. It's the spendable, physical money left over after the business pays for its daily operations AND buys the big, expensive upgrades (like new factories or servers) it needs to survive. This is the 'free' money they can use to pay dividends or buy back stock.
$-139.8M
-86.1%
-207.1%
FCF MarginThe ultimate cash conversion rate. It shows how good the company is at turning regular sales directly into cold, hard, spendable cash. A high percentage means the business is an absolute cash-printing machine.
—
—
—
Debt / EquityThe financial risk gauge. It compares how much of the company's empire was built using borrowed money (loans) versus the owners' own money (shareholders). A high number means they are heavily leveraged and playing a riskier game; a low number means they are playing it safe.
9.2%
-13.6%
+6.8%
Current RatioThe 12-month survival check. It simply compares the cash they have right now (plus things they can quickly turn into cash) against the immediate bills they absolutely must pay this year. A score above 1 means they have enough in the wallet to cover the upcoming bills without panicking.
1.55x
-55.4%
-0.5%
Total AssetsThe absolute size of the company's empire. It bundles together absolutely everything of value they own—from the cash in the register and the inventory in the warehouse, to the software patents in the vault and the factories on the ground.