
FXEmpire8/19/2026Neutral
Natural Gas and Oil Forecast: Hormuz Risks Persist as WTI and Brent Hold Gains
WTI and Brent hold their recoveries as Hormuz export uncertainty persists, while ample U.S. production keeps natural gas supply comfortable.

W&T Offshore, Inc. operates as an independent energy producer, primarily focused on the identification, acquisition, and development of crude oil and natural ...
Plutux is not an investment adviser. Market data and AI-generated analysis are for information and education only, not investment advice. Disclaimer
Est. EPS $-0.06 · Revenue $136.40M · 2 analysts
Est. EPS $-0.01 · Revenue $138.60M · 2 analysts
Est. EPS $-0.08 · Revenue $580.40M · 3 analysts
Est. EPS $-0.01 · Revenue $137.45M · 1 analysts
$0.04 per share
$0.04 per share
| Metric | Latest | YoYYoY means Year-over-Year. It compares the latest annual value with the previous annual value to show long-term trend strength. | QoQQoQ means Quarter-over-Quarter. It compares the latest quarter with the immediately previous quarter to show short-term momentum changes. |
|---|---|---|---|
| RevenueThe total money that came through the front door from selling things, before paying a single bill. Think of it as the grand total of every credit card swipe from customers. (YoY compares this year to last year's performance, while QoQ compares the current three months to the previous three). | $501.5M | -4.5% | +8.4% |
| Net IncomeThe absolute bottom line. If the company paid every single supplier, employee, banker, and tax collector, this is the actual money left in their pocket at the end of the day. | $-150.1M | -72.2% | +155.8% |
| Gross MarginThe basic markup. If they sell a $100 pair of sneakers, this percentage tells you how much of that price tag is profit right after paying for the rubber and shoelaces, but before paying for things like store rent or TV commercials. | +71.7% | +6.3% | +97.5% |
| Operating MarginThe 'day job' efficiency score. Out of every dollar a customer spends, this shows how many cents the company keeps after making the product AND paying for all the everyday corporate overhead (like salaries, marketing, and keeping the lights on). | -10.5% | -31.1% | +42.6% |
| Net MarginThe final take-home percentage. When you strip away every conceivable cost, tax, and interest payment, this is the exact number of cents the company truly gets to keep from every dollar in sales. | -29.9% | -80.4% | +151.4% |
| Free Cash FlowThe holy grail of corporate cash. It's the spendable, physical money left over after the business pays for its daily operations AND buys the big, expensive upgrades (like new factories or servers) it needs to survive. This is the 'free' money they can use to pay dividends or buy back stock. | $27.8M | +147.3% | +411.0% |
| FCF MarginThe ultimate cash conversion rate. It shows how good the company is at turning regular sales directly into cold, hard, spendable cash. A high percentage means the business is an absolute cash-printing machine. | +5.5% | +149.6% | +386.9% |
| Debt / EquityThe financial risk gauge. It compares how much of the company's empire was built using borrowed money (loans) versus the owners' own money (shareholders). A high number means they are heavily leveraged and playing a riskier game; a low number means they are playing it safe. | -175.6% | +76.6% | -13.2% |
| Current RatioThe 12-month survival check. It simply compares the cash they have right now (plus things they can quickly turn into cash) against the immediate bills they absolutely must pay this year. A score above 1 means they have enough in the wallet to cover the upcoming bills without panicking. | 1.02x | +15.0% | +17.7% |
| Total AssetsThe absolute size of the company's empire. It bundles together absolutely everything of value they own—from the cash in the register and the inventory in the warehouse, to the software patents in the vault and the factories on the ground. | $955.8M | -13.0% | +0.0% |
| Metric | Annual (A vs E) | Annual Surprise | Quarter (A vs E) | Quarter Surprise |
|---|---|---|---|---|
| EPS Surprise | -1.01 vs -0.49 | -104.0% | 0.08 vs -0.06 | +237.7% |
| Revenue Surprise | $501.5M vs $507.4M | -1.2% | $162.6M vs $136.4M | +19.2% |
| Date | Executive | Title | Security | Side | Shares | Price |
|---|---|---|---|---|---|---|
| Aug 8, 2026 | Gamblin Huan | officer: EVP & Chief Technical Officer | Common Stock | A | 8,312 | — |
| Aug 8, 2026 | Gamblin Huan | officer: EVP & Chief Technical Officer | Common Stock | D | 3,271 | $3.43 |
| Aug 8, 2026 | Gamblin Huan | officer: EVP & Chief Technical Officer | Restricted Stock Units | D | 8,312 | — |
| Aug 8, 2026 | Williford William J | officer: EVP & Chief Operating Officer | Common Stock | A | 56,075 | — |
| Aug 8, 2026 | Williford William J | officer: EVP & Chief Operating Officer | Common Stock | D | 22,066 | $3.43 |
Operator: Ladies and gentlemen, thank you for standing by. Welcome to the W&T Offshore Second Quarter 2026 Conference Call. [Operator Instructions] This conference is being recorded, and a replay will be made available on the company's website following the call. I would now like to turn the conference over to Al Petrie, Investor Relations Coordinator. Please go ahead. Al Petrie: Thank you, Danielle. And on behalf of the management team, I would like to welcome all of you to today's conference call to review W&T Offshore's Second Quarter 2026 Financial and Operational Results. Before we begin, I'd like to remind you that our comments may include forward-looking statements. It should be noted that a variety of factors could cause W&T's actual results to differ materially from the anticipated results or expectations expressed in these forward-looking statements. Today's call may also contain certain non-GAAP financial measures. Please refer to the earnings release that we issued yesterday for disclosures on forward-looking statements and reconciliations of non-GAAP measures. With that, I would like to turn the call over to Tracy Krohn, our Chairman and CEO. Tracy Krohn: Thanks, Al. Good morning, everyone, and welcome to our conference call. With me today are William Wilford, our Executive VP and Chief Operating Officer; Sameer Parasnis, our Executive VP and Chief Financial Officer; and Trey Hartman, our Vice President and Chief Accounting Officer. We're all available to answer questions after our prepared remarks. So we've delivered consistently strong operational and financial results over the past 43 years. I'm very pleased to report that our Q2 results continued this positive trend, and we are in a much stronger financial position heading into the second half of 2026. The second quarter delivered net income of $12.6 million, or $0.08 per share, and over $54 million in adjusted EBITDA. That's in line with the first quarter and in the first half of 2026, we generated almost $110 million. In the second quarter, we also increased our free cash flow by 50% compared to Q1 2026 to $31 million. We've now amassed over $52 million in free cash flow in the first half of 2026. This has enabled us to increase our cash on hand to over $150 million, driving our net debt down to $200 million. So on a 12-month trailing basis, our net debt to adjusted EBITDA is down to 1.2x, and assuming sustained margin levels into the second half of 2026, this should continue to go down and potentially be under 1x at year-end 2026. These strong financial results are driven by our operational focus with a particular emphasis on optimizing and maintaining solid production, while continuing to manage costs prudently. So in quarter 2, our production was 34,700 barrels of oil equivalent per day at the midpoint of guidance, and up 3% from the same period in 2025. So despite no new drilling and no new acquisitions. This solid quarter results start with our ability to maintain strong …
| Name | Title | Compensation | Gender | Year Born | Status |
|---|---|---|---|---|---|
Tracy W. Krohn | Founder, Chairman, Chief Executive Officer & President | USD 1,865,898 | Male | 1955 | Active |
Sameer Parasnis | Executive Vice President & Chief Financial Officer | USD 976,885 | Male | 1975 | Active |
William J. Williford | ?Executive Vice President & Chief Operating Officer | USD 946,870 | Male | 1973 | Active |
Huan Gamblin | Executive Vice President & Chief Technical Officer | USD 855,425 | Male | 1983 | Active |
George J. Hittner | Executive Vice President, General Counsel & Corporate Secretary | USD 854,104 | Male | 1979 | Active |
Al Petrie | Investor Relations Coordinator | — | Male | — | Active |
Alvin T. Haynes | Vice President, Chief Information Officer & Chief Information Security Officer | — | Male | — | Active |
W. Allen Tate | Senior Vice President of Marketing | — | Male | — | Active |
Todd E. Grabois | Vice President & Treasurer | — | Male | 1960 | Active |
Kristen Ecklund | Vice President of Human Resources | — | Female | — | Active |
Bart Hartman | Vice President & Chief Accounting Officer | — | Male | 1975 | Active |
WTI and Brent hold their recoveries as Hormuz export uncertainty persists, while ample U.S. production keeps natural gas supply comfortable.
Crude oil continues to move on each headline as the Middle East is still front and center as far as global concerns rank, with rates continuing to be an issue as well.
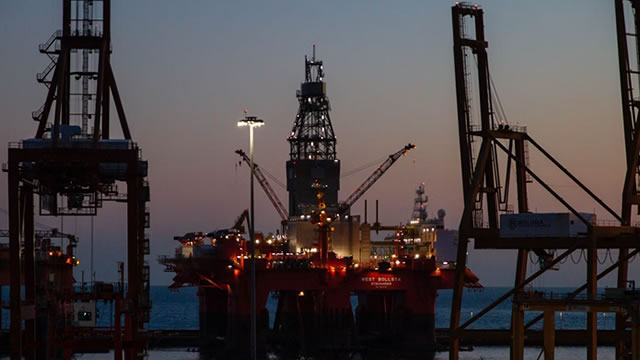
The crude oil market initially pulled back a bit after gapping higher on Monday before pulling back, only to be thrown higher by headlines again.
Oil markets balance slowing Hormuz shipping against weaker global demand as WTI and Brent consolidate while natural gas breaks key support.
WTI and Brent rallied as Hormuz tanker attacks, an indefinite Iran blockade threat and a Russian export outage rebuilt oil's supply premium.