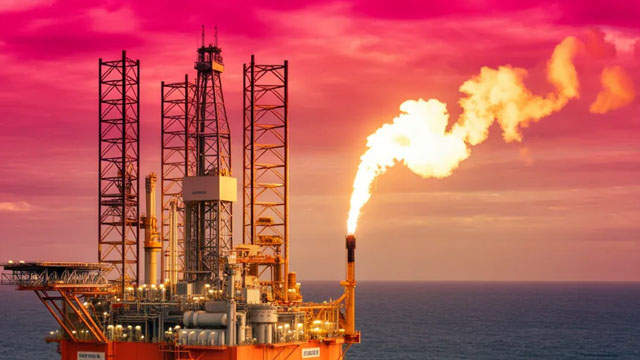
Ovintiv Inc. is a leading North American energy company engaged in the exploration, production, and sale of natural gas, crude oil, and natural gas liquids (NGLs). The company's operations are managed across three main segments: U.S. operations, Canadian operations, and market optimization. Its portfolio is anchored in premier resource plays, ...Ovintiv Inc. is a leading North American energy company engaged in the exploration, production, and sale of natural gas, crude oil, and natural gas liquids (NGLs). The company's operations are managed across three main segments: U.S. operations, Canadian operations, and market optimization. Its portfolio is anchored in premier resource plays, including the Permian Basin in West Texas, the Anadarko Basin in west-central Oklahoma, and the Montney region spanning northeastern British Columbia and northwestern Alberta. Additional holdings include the Bakken formation in North Dakota, the Uinta Basin in central Utah, the Horn River Basin, and Wheatland in southern Alberta.
Ovintiv was formed in 2020, when Encana Corporation, a Canadian company with a long history dating back to the late 1800s, rebranded and moved its headquarters to Denver, Colorado. The company is publicly traded on the New York Stock Exchange under the ticker OVV, with a market capitalization of approximately $16.4 billion as of the latest data. The company employs around 1,465 people worldwide.
Under the leadership of President and CEO Brendan McCracken, Ovintiv focuses on innovative technology and operational discipline to optimize performance and deliver durable returns to shareholders. The company's financial metrics indicate a strong operational performance, with an EBITDA margin of 29.4%, a net profit margin of 9.5%, and a return on equity of 8.3%. The company generates substantial free cash flow, with a free cash flow yield of 26.7%, and maintains a healthy balance sheet with a debt-to-equity ratio of 0.428.
Ovintiv's business strategy emphasizes short-cycle, high-return projects that generate quick capital turnover. The company is committed to responsible energy development, focusing on reducing environmental impact while meeting global energy demand. Its products are sold through a combination of long-term contracts and spot market sales, optimized through its market optimization segment.
In terms of corporate governance, the company's key executives include CEO Brendan McCracken, EVP & CFO Corey Code, and other senior leaders. The company has a dividend payout ratio of 34.7%, returning value to shareholders through dividends and share buybacks.
Overall, Ovintiv is a well-positioned energy producer with a strong asset base, a clear strategic focus, and a commitment to shareholder returns, making it a key player in the North American energy landscape.
YoYYoY means Year-over-Year. It compares the latest annual value with the previous annual value to show long-term trend strength.
QoQQoQ means Quarter-over-Quarter. It compares the latest quarter with the immediately previous quarter to show short-term momentum changes.
RevenueThe total money that came through the front door from selling things, before paying a single bill. Think of it as the grand total of every credit card swipe from customers. (YoY compares this year to last year's performance, while QoQ compares the current three months to the previous three).
$8.7B
-4.5%
+19.0%
Net IncomeThe absolute bottom line. If the company paid every single supplier, employee, banker, and tax collector, this is the actual money left in their pocket at the end of the day.
$1.2B
+10.4%
+172.4%
Gross MarginThe basic markup. If they sell a $100 pair of sneakers, this percentage tells you how much of that price tag is profit right after paying for the rubber and shoelaces, but before paying for things like store rent or TV commercials.
+28.6%
-47.5%
+0.4%
Operating MarginThe 'day job' efficiency score. Out of every dollar a customer spends, this shows how many cents the company keeps after making the product AND paying for all the everyday corporate overhead (like salaries, marketing, and keeping the lights on).
+21.6%
+25.5%
+16.3%
Net MarginThe final take-home percentage. When you strip away every conceivable cost, tax, and interest payment, this is the exact number of cents the company truly gets to keep from every dollar in sales.
+14.2%
+15.7%
+160.8%
Free Cash FlowThe holy grail of corporate cash. It's the spendable, physical money left over after the business pays for its daily operations AND buys the big, expensive upgrades (like new factories or servers) it needs to survive. This is the 'free' money they can use to pay dividends or buy back stock.
$1.5B
+6.1%
+134.6%
FCF MarginThe ultimate cash conversion rate. It shows how good the company is at turning regular sales directly into cold, hard, spendable cash. A high percentage means the business is an absolute cash-printing machine.
+17.2%
+11.2%
+97.1%
Debt / EquityThe financial risk gauge. It compares how much of the company's empire was built using borrowed money (loans) versus the owners' own money (shareholders). A high number means they are heavily leveraged and playing a riskier game; a low number means they are playing it safe.
67.3%
+10.4%
-35.8%
Current RatioThe 12-month survival check. It simply compares the cash they have right now (plus things they can quickly turn into cash) against the immediate bills they absolutely must pay this year. A score above 1 means they have enough in the wallet to cover the upcoming bills without panicking.
0.54x
+6.7%
+78.5%
Total AssetsThe absolute size of the company's empire. It bundles together absolutely everything of value they own—from the cash in the register and the inventory in the warehouse, to the software patents in the vault and the factories on the ground.
Operator: Good day, ladies and gentlemen, and thank you for standing by. Welcome to Ovintiv's 26 Second Quarter Results Conference Call. As a reminder, today's call is being recorded. At this time, all participants are in a listen-only mode. Following the presentation, we will conduct a question-and-answer session. Members of the investment community will have the opportunity to ask questions and can join the queue at any time by pressing star 1. For members of the media attending in a listen-only mode today, you may quote statements made by any of your Ventev representatives. However, members of the media who wish to quote others who are speaking on this call today we advise you to contact those individuals directly to obtain their consent. Please be advised that this conference call may not be recorded. Or rebroadcast without the expressed consent of Ovintiv. I would now like to turn the conference call over to Jason Verhaest from Investor Relations. Please go ahead, Mr. Verhaest.
Jason Verhaest: Thanks, Joanna, and welcome, everyone, to our second quarter 26 conference call. This call is being webcast, and the slides are available on our website at ovintiv.com. Please take note of the advisory regarding forward looking statements at the beginning of our slides and our disclosure documents filed on EDGAR and SEDAR plus Following prepared remarks, we will be available to take your questions. I will now turn the call over to our President and CEO, Brendan Michael McCracken.
Brendan Michael McCracken: Thanks, Jason. Good morning, everybody, and thank you for joining us. Our second quarter results demonstrate the strength of our durable return strategy in the business we have built. Our future is also looking bright with a boost to our oil production, driving more free cash flow, differentiated cost and productivity results, the demonstrated ability to replace our inventory, and ramping buybacks. We have demonstrated industry leading operational performance through stacked innovation and execution excellence. Our culture, our expertise, and our unique private dataset have created a distinct operating advantage. We have materially fortified our balance sheet, bringing our leverage ratio well below 1x. We continue to demonstrate our proven track record of capital allocation, while delivering superior, durable returns to our shareholders. We are 1 of the most innovative, efficient, opportunity-rich E&Ps in North America, and we are very excited to be operating from this position of strength. Both our Permian and our Montney year to date results are tracking above type curve. and continue to lead the league in their respective basins. This is driving an increase to our full year oil production guidance, which equates to about 4% growth on a per share basis. With no additional capital or activity. Our cash flow per share and free cash flow both beat consensus estimates by significant margin this quarter, and we returned approximately 63% of free cash …