%22%2F%3E%0A%20%20%3Ccircle%20cx%3D%22220%22%20cy%3D%22150%22%20r%3D%22180%22%20fill%3D%22%2322d3ee%22%20fill-opacity%3D%220.12%22%2F%3E%0A%20%20%3Ccircle%20cx%3D%221010%22%20cy%3D%22130%22%20r%3D%22220%22%20fill%3D%22%2338bdf8%22%20fill-opacity%3D%220.08%22%2F%3E%0A%20%20%3Ccircle%20cx%3D%22920%22%20cy%3D%22520%22%20r%3D%22170%22%20fill%3D%22%2322d3ee%22%20fill-opacity%3D%220.06%22%2F%3E%0A%20%20%3Cpath%20d%3D%22M140%20430h920%22%20stroke%3D%22url(%23line)%22%20stroke-width%3D%2212%22%20stroke-linecap%3D%22round%22%2F%3E%0A%20%20%3Cpath%20d%3D%22M220%20360c120-150%20260-220%20380-220s260%2070%20380%20220%22%20fill%3D%22none%22%20stroke%3D%22%2367e8f9%22%20stroke-opacity%3D%220.5%22%20stroke-width%3D%2216%22%20stroke-linecap%3D%22round%22%20stroke-linejoin%3D%22round%22%2F%3E%0A%20%20%3Cpath%20d%3D%22M300%20398h600%22%20stroke%3D%22%2394a3b8%22%20stroke-opacity%3D%220.24%22%20stroke-width%3D%228%22%20stroke-linecap%3D%22round%22%2F%3E%0A%20%20%3Ctext%20x%3D%22220%22%20y%3D%22510%22%20fill%3D%22%23e2e8f0%22%20fill-opacity%3D%220.7%22%20font-family%3D%22Arial%2C%20Helvetica%2C%20sans-serif%22%20font-size%3D%2238%22%20letter-spacing%3D%228%22%3EINSIGHTS%3C%2Ftext%3E%0A%3C%2Fsvg%3E)
Supply-chain choke point
The “slot” matters more than the contract—turbine deliveries are getting booked years in advance
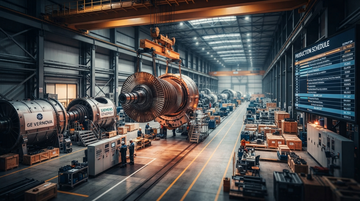
Gas-turbine projects are no longer constrained only by engineering schedules; they’re increasingly constrained by where each OEM’s manufacturing calendar is already “reserved.” When hyperscalers and other bulk-load customers accelerate timelines, the market responds the same way it does in semiconductors: the order book becomes the scheduling device, and the delivery window becomes the scarce resource. That shifts investment impact from who can sign fastest to who already secured the earliest delivery slots.
Where value shows up in the power-build chain (and where it can get trapped)
Upstream constraint
Gas-turbine manufacturing lead times and component throughput (OEM production slots).
Midstream sequencing
Project permitting, interconnection queues, construction readiness, and site air/emissions controls.
Downstream reality
Even a confirmed turbine order may miss the target “online” date if permits or site work slip.
Who captures value
OEMs with order visibility and manufacturing execution; EPCs and services with retrofit/performance work; but delays can re-route where project cash milestones land.
Verified demand pressure
How AI-era load can create a timing mismatch: turbines arrive, but permits dictate “go-live”
The order book solves the “can we build it?” question for OEMs, but not the “can we legally operate it here, when?” question for plants. Hyperscaler generation buildouts—often concentrated in specific geographies—can trigger air-permitting and emissions scrutiny that stretches timelines and adds compliance sequencing requirements. When that happens, projects can end up holding turbines that are physically manufacturable but administratively blocked from operating at the intended cadence.
OEM capacity + financial staying power
GE Vernova and Siemens Energy are financially positioned to monetize long backlogs—yet the margin outcome depends on execution and delivery timing
To understand who benefits when turbine slots are scarce, investors need to connect backlog economics to balance-sheet and cash-flow resilience. GE Vernova’s latest trailing twelve months show revenue of $41.37B and free cash flow of $12.44B (TTM through Jun 30, 2026), with net debt that is negative on the same basis (net cash). That matters because long-lead projects can require working-capital swings and execution investment before cash milestones fully land.
GE Vernova (GEV) revenue
$41.37B
TTM through Jun 30, 2026 (reported via company financial statements)
GE Vernova (GEV) free cash flow
$12.44B
TTM through Jun 30, 2026
GE Vernova (GEV) net debt
$-9.16B
TTM through Jun 30, 2026 (net cash)
Siemens Energy (SMERY/OTC) EBIT margin
9.7%
TTM through Sep 30, 2024 (latest annual snapshot in the dataset)
| Company | Period reference | Revenue | Free cash flow | Balance-sheet signal |
|---|---|---|---|---|
| GE Vernova GEV | TTM through Jun 30, 2026 | $41.37B | $12.44B | Net cash (net debt $-9.16B) |
| Siemens Energy Siemens Energy | TTM / annual metric window in dataset | — | — | Leverage and profitability depend on execution; figures are not fully itemized here |
Causal chain investors can act on
Why the order book becomes the choke point for 2027: manufacturing slots + permitting clocks run on different schedules
- AI-era procurement accelerates demand concentration, which pushes OEM order books to the point where earlier delivery windows sell first.
- Permitting and emissions compliance then governs when plants can operate; that clock can be longer than turbine assembly lead time in specific jurisdictions.
- If a jurisdiction slows, turbines can be completed but not monetized via energy output until operating approvals arrive—delaying downstream cash flows.
For investors, this creates a distinct “who wins” framework. OEMs benefit from order intake and delivery execution when their manufacturing schedule aligns with customer project readiness. But the biggest downstream revenue displacement risk sits with customers whose schedules rely on operating approvals arriving on the original cadence. In practice, that makes timing—rather than just demand—an investable variable.
Financial confirmation from listed players
GE Vernova: cash generation that can support long-cycle execution
GE Vernova’s cash-flow profile is a useful indicator of execution capacity during long lead times. In the trailing twelve months through Jun 30, 2026, it reported $14.14B of net cash provided by operating activities and $1.70B of capex, implying $12.44B of free cash flow on the same basis. That combination—strong operating cash and meaningful capex—suggests the company can sustain both the industrial ramp and the financial overhead that comes with multi-year project delivery.
Supply-chain lens beyond turbines
The value capture shifts upstream when permitting constrains downstream “go-live”—services, controls, and grid buildouts become the escape valves
Even when OEM slots are constrained, the system still needs to close the remaining gaps: controls integration, grid interconnection timing, site readiness, and emissions controls compliance. These workstreams can keep generating value (and cash) even when full commissioning slips. That’s why investors should not treat the turbine itself as the only chokepoint. The order book is the mechanical throttle; permitting and grid sequencing decide whether the mechanical throttle turns into megawatt-hours by the year targeted.
Investor checklist
What to watch next (2026–2027): delivery windows vs. operating approvals
GE Vernova: scale of cash generation vs. revenue (trend anchor for execution capacity)
Using reported figures from company financial statements; this is not a valuation model.
Unit: USD
Revenue (TTM through Jun 30, 2026)
41,368,000,000
Free cash flow (TTM through Jun 30, 2026)
12,439,000,000
- For OEMs: watch whether order intake stays high while deliveries roll out as scheduled—this is where slot scarcity converts into monetization.
- For project developers: watch the gap between turbine receipt and operating permit timing; that gap is the forecast risk to capacity actually online by 2027.
- For service and grid integrators: watch whether “intermediate” scope (controls, upgrades, compliance work) accelerates when commissioning slips.
Listed equities with the clearest linkage to the “order-book then permit” transmission
- Strong operating cash flow supports long-lead execution, with free cash flow of $12.39B in the TTM through Jun 30, 2026.
- If turbine slots convert into deliveries as planned, order-book monetization can outpace go-live delays because revenue recognition can be tied to delivery milestones.
- If permitting delays force customer rescheduling, margin risk shifts toward execution and working capital; cash conversion becomes the key investor check.
- If Siemens Energy’s manufacturing capacity scales ahead of customer readiness, delivery execution can defend margins even when projects slip into later commissioning years.
- If the permitting bottleneck tightens further, project commissioning can lag, raising the chance of short-term revenue timing variance.
- Investors should monitor how quickly its cash generation improves relative to revenue; profitability is the “permit-delay absorber.”
- Construction and grid buildouts can partially offset turbine commissioning delays; backlog strength can still support demand even when plant go-live slips.
- If power-build slowdowns spread into civil works budgets, orders can soften, making cash flow the near-term tell.
- If backup power and site power expand alongside hyperscaler builds, generation-adjacent demand can persist even when turbine commissioning is delayed.
- If macro capex resets due to permitting delays, industrial power demand can normalize, reducing forward visibility.