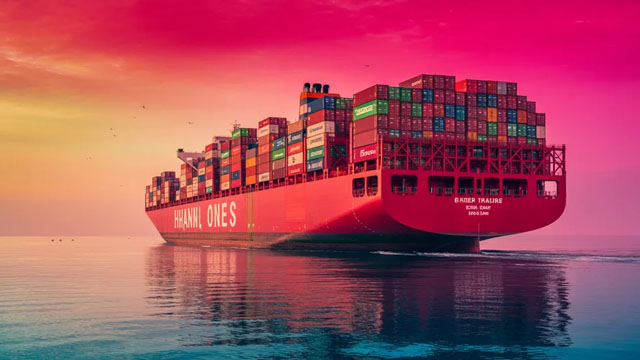
United Maritime Corporation is a global maritime transport firm, offering shipping services across the world. Its current assets include a single Capesize ...
United Maritime Corporation (NASDAQ: USEA) is an international maritime transport company focused on worldwide seaborne transportation of dry bulk commodities. Based in Glyfada, Greece, the company was incorporated in 2022 and operates as a publicly traded shipping platform that participates in the global dry bulk market, where revenue and profitability ...United Maritime Corporation (NASDAQ: USEA) is an international maritime transport company focused on worldwide seaborne transportation of dry bulk commodities. Based in Glyfada, Greece, the company was incorporated in 2022 and operates as a publicly traded shipping platform that participates in the global dry bulk market, where revenue and profitability are typically driven by charter rates, vessel utilization, prevailing freight demand, and operating cost efficiency.
From a business perspective, United Maritime’s operating model centers on owning and operating a small fleet of dry bulk carriers. The provided company description references operational ownership of at least a Capesize dry bulk vessel (with a large deadweight tonnage), indicating the company’s exposure to commodity shipping cycles and the economics of large-scale dry bulk transportation. Other supplied excerpts mention a broader fleet composition (e.g., Capesize, Kamsarmax, and Panamax vessels), and social/market data suggests the firm has operated multiple vessels in this niche. In practice, shipping revenues are commonly realized through time charters and/or voyage charters, with counterparties negotiating terms tied to market conditions.
Product and service-wise, United Maritime’s “product” is transportation capacity—moving bulk commodities across international shipping routes. The company also benefits from the logistical and operational know-how required to maintain vessel readiness, manage voyage planning, and control day-to-day marine operations. Because dry bulk shipping is capital intensive, the balance between fleet size, vessel age/efficiency, and financing structure can materially impact returns.
Cost structure considerations for a company like USEA typically include voyage costs, port and canal charges, crew-related expenses, maintenance/drydocking, insurance, and other vessel operating expenses. The financial metrics supplied in the dataset (e.g., liquidity and profitability indicators showing losses in the most recent TTM snapshot) suggest the firm’s earnings can be cyclical and sensitive to market rates, utilization, and fixed-cost absorption. The company also pays dividends as indicated by the dataset’s dividend-per-share and yield metrics, though shipping dividends are often not guaranteed and depend on cash flow generation.
Key people include Stamatios Tsantanis, listed as Chairman and CEO and a Director. With a very small employee base reported in the dataset (6 full-time employees), the company likely relies on outsourced or partner-supported maritime operations and administrative functions typical for smaller public shipping firms.
Overall, United Maritime’s strategy is to participate in global dry bulk transportation through a controlled, capital-efficient fleet approach. The primary “wish” for shipping operators generally revolves around maintaining vessel availability, optimizing charter employment to capture favorable freight periods, and managing capital allocation—especially acquisitions, disposals, and refinancings—to sustain resilience through freight-cycle volatility.
YoYYoY means Year-over-Year. It compares the latest annual value with the previous annual value to show long-term trend strength.
QoQQoQ means Quarter-over-Quarter. It compares the latest quarter with the immediately previous quarter to show short-term momentum changes.
RevenueThe total money that came through the front door from selling things, before paying a single bill. Think of it as the grand total of every credit card swipe from customers. (YoY compares this year to last year's performance, while QoQ compares the current three months to the previous three).
$37.8M
-16.8%
+25.8%
Net IncomeThe absolute bottom line. If the company paid every single supplier, employee, banker, and tax collector, this is the actual money left in their pocket at the end of the day.
$-6.2M
-82.9%
+934.5%
Gross MarginThe basic markup. If they sell a $100 pair of sneakers, this percentage tells you how much of that price tag is profit right after paying for the rubber and shoelaces, but before paying for things like store rent or TV commercials.
+16.5%
-68.6%
+28.9%
Operating MarginThe 'day job' efficiency score. Out of every dollar a customer spends, this shows how many cents the company keeps after making the product AND paying for all the everyday corporate overhead (like salaries, marketing, and keeping the lights on).
-0.2%
-102.1%
+54.7%
Net MarginThe final take-home percentage. When you strip away every conceivable cost, tax, and interest payment, this is the exact number of cents the company truly gets to keep from every dollar in sales.
-16.4%
-120.0%
+763.6%
Free Cash FlowThe holy grail of corporate cash. It's the spendable, physical money left over after the business pays for its daily operations AND buys the big, expensive upgrades (like new factories or servers) it needs to survive. This is the 'free' money they can use to pay dividends or buy back stock.
$1.5M
-51.7%
—
FCF MarginThe ultimate cash conversion rate. It shows how good the company is at turning regular sales directly into cold, hard, spendable cash. A high percentage means the business is an absolute cash-printing machine.
+3.9%
-42.0%
—
Debt / EquityThe financial risk gauge. It compares how much of the company's empire was built using borrowed money (loans) versus the owners' own money (shareholders). A high number means they are heavily leveraged and playing a riskier game; a low number means they are playing it safe.
122.5%
-24.7%
+9.5%
Current RatioThe 12-month survival check. It simply compares the cash they have right now (plus things they can quickly turn into cash) against the immediate bills they absolutely must pay this year. A score above 1 means they have enough in the wallet to cover the upcoming bills without panicking.
0.68x
-6.9%
—
Total AssetsThe absolute size of the company's empire. It bundles together absolutely everything of value they own—from the cash in the register and the inventory in the warehouse, to the software patents in the vault and the factories on the ground.
Operator: Thank you for standing by. Ladies and gentlemen, and welcome to the United Maritime Corporation Conference Call for the Fourth Quarter and Year Ended December 31, 2025 financial results. We have with us Mr. Stamatios Tsantanis, Chairman and CEO, and Mr. Stavros Gyftakis, Chief Financial Officer of United Maritime Corporation. At this time, all participants are in a listen-only mode. If you would like to ask a question, please press 11 on your telephone keypad, and you will hear an automated message advising your hand is raised. Please be advised that this conference call is being recorded today, Thursday, March 12, 2026. The archived webcast of the conference call will soon be made available on the United Maritime Corporation website, https://www.unitedmaritime.gr, under the Investor Relations section. Many of the remarks today contain forward-looking statements based on current expectations. Actual results may differ materially from the results projected from those forward-looking statements. Additional information concerning factors that can cause the actual results to differ materially from those in the forward-looking statements is contained in the fourth quarter and year ended 12/31/2025 earnings release, which is available on the United Maritime Corporation website again, https://www.unitedmaritime.gr. I would now like to turn the conference over to one of your speakers today, the Chairman and CEO of the company, Mr. Stamatios Tsantanis. Please go ahead, sir.
Stamatios Tsantanis: Hello, everybody. Welcome to United Maritime Corporation’s conference call to discuss our financial results for the fourth quarter and full year period ended 12/31/2025. During the fourth quarter, United Maritime Corporation generated net revenues of $6,600,000 and EBITDA of $1,500,000. More importantly, since our last update, we have executed a series of strategic initiatives aimed at enhancing the company's earnings profile, strengthening our balance sheet, and increasing our free cash flow generation capacity. In addition, we are pleased to declare our 13th consecutive quarterly dividend, a milestone that reflects our commitment for capital returns. Since initiating our dividend program in November 2022, United Maritime Corporation has declared cumulative cash dividends of approximately $1.84 per share. With stronger cash generation now secured through recently fleet employment, we are confident in our ability to sustain a competitive level of distributions while preserving the financial flexibility to pursue accretive growth opportunities. A central pillar of our 2025, 2026 strategy has been disciplined capital reallocation, divesting lower returning assets and redeploying proceeds into higher earning Capesize exposure. In early 2026, we agreed to sell the 2009-built Kamsarmax Cretan c for a net price of $14,700,000, generating approximately $6,000,000 in net cash proceeds after debt repayment. We also agreed to exit our investment in the offshore …