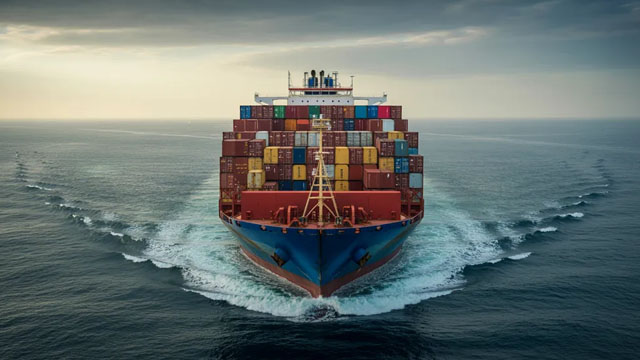
Ardmore Shipping Corporation is a global enterprise dedicated to the maritime carriage of refined oil derivatives and various chemical substances. By February ...
Ardmore Shipping Corporation (ASC) is a publicly traded tanker operator focused on the global carriage of refined oil derivatives and chemical substances. The company started operations in 2010 and is headquartered in Hamilton, Bermuda, serving customers through worldwide maritime trade routes. Its core business is the ownership and operation of ...Ardmore Shipping Corporation (ASC) is a publicly traded tanker operator focused on the global carriage of refined oil derivatives and chemical substances. The company started operations in 2010 and is headquartered in Hamilton, Bermuda, serving customers through worldwide maritime trade routes. Its core business is the ownership and operation of product and chemical tankers, which enables it to earn revenue primarily from freight transportation—typically under time charters and/or spot exposure depending on market conditions and vessel employment strategy.
From a product/service perspective, Ardmore positions its fleet to support energy and chemical logistics needs. Tankers must be matched to cargo requirements (e.g., refined products versus chemical parcels), compliance standards, and operational performance. The sources indicate Ardmore maintains a fleet of roughly the mid-to-high 20s of modern, twin-hulled vessels designed for product and chemical transport, reflecting an emphasis on operational reliability, safety, and marketability. Customer types referenced include large oil industry companies, independent petroleum operators, trading houses, chemical manufacturers, and shipping pool service participants—illustrating a diversified counterparty base within maritime freight.
Economically, tanker operators face costs that are largely driven by fleet utilization and vessel operating economics: vessel ownership costs, crew and technical management, insurance, maintenance/drydocking, port expenses, and fuel/consumables. Capital expenditure requirements are material in shipping due to vessel acquisition, upgrades, and periodic drydockings. In that context, Ardmore’s financial profile (as shown in the provided dataset) reflects strong profitability measures on a trailing-twelve-month basis, with positive margins and return on equity, along with a relatively low leverage profile (debt ratios are small in the provided snapshot). Such characteristics can matter because shipping cycles can be volatile; operators that maintain liquidity and manage leverage can better withstand downturns and more effectively fund fleet sustainment.
Key people: The provided information names Gernot Ruppelt as Chief Executive Officer. The company has also discussed leadership transition previously involving founder/CEO Anthony Gurnee, indicating an evolution in executive management over time.
In terms of “wishes” or strategic direction (inferred from industry norms and the company’s stated investor focus), Ardmore’s likely ongoing priorities include maintaining and modernizing its fleet, maximizing vessel utilization, managing counterparty and chartering risks, and continuing to deliver shareholder value through dividends and disciplined capital management—particularly important for a tanker business exposed to commodity-linked shipping demand and interest-rate/financing conditions.
YoYYoY means Year-over-Year. It compares the latest annual value with the previous annual value to show long-term trend strength.
QoQQoQ means Quarter-over-Quarter. It compares the latest quarter with the immediately previous quarter to show short-term momentum changes.
RevenueThe total money that came through the front door from selling things, before paying a single bill. Think of it as the grand total of every credit card swipe from customers. (YoY compares this year to last year's performance, while QoQ compares the current three months to the previous three).
$310.2M
-23.6%
+32.2%
Net IncomeThe absolute bottom line. If the company paid every single supplier, employee, banker, and tax collector, this is the actual money left in their pocket at the end of the day.
$41.0M
-69.2%
+156.6%
Gross MarginThe basic markup. If they sell a $100 pair of sneakers, this percentage tells you how much of that price tag is profit right after paying for the rubber and shoelaces, but before paying for things like store rent or TV commercials.
+34.2%
-11.2%
+31.3%
Operating MarginThe 'day job' efficiency score. Out of every dollar a customer spends, this shows how many cents the company keeps after making the product AND paying for all the everyday corporate overhead (like salaries, marketing, and keeping the lights on).
+26.1%
-17.4%
+47.2%
Net MarginThe final take-home percentage. When you strip away every conceivable cost, tax, and interest payment, this is the exact number of cents the company truly gets to keep from every dollar in sales.
+13.2%
-59.7%
+94.1%
Free Cash FlowThe holy grail of corporate cash. It's the spendable, physical money left over after the business pays for its daily operations AND buys the big, expensive upgrades (like new factories or servers) it needs to survive. This is the 'free' money they can use to pay dividends or buy back stock.
$-39.1M
-139.3%
+85.4%
FCF MarginThe ultimate cash conversion rate. It shows how good the company is at turning regular sales directly into cold, hard, spendable cash. A high percentage means the business is an absolute cash-printing machine.
-12.6%
-151.4%
+40.3%
Debt / EquityThe financial risk gauge. It compares how much of the company's empire was built using borrowed money (loans) versus the owners' own money (shareholders). A high number means they are heavily leveraged and playing a riskier game; a low number means they are playing it safe.
20.3%
+191.8%
-68.9%
Current RatioThe 12-month survival check. It simply compares the cash they have right now (plus things they can quickly turn into cash) against the immediate bills they absolutely must pay this year. A score above 1 means they have enough in the wallet to cover the upcoming bills without panicking.
4.33x
+2.0%
+11.9%
Total AssetsThe absolute size of the company's empire. It bundles together absolutely everything of value they own—from the cash in the register and the inventory in the warehouse, to the software patents in the vault and the factories on the ground.
Operator: Good morning, ladies and gentlemen, and welcome to Ardmore Shipping's Second Quarter 26 Earnings Conference Call. Today's call is being recorded and an audio webcast and presentation are available in the Investor Relations section of the company's website. www.osmoshipping.com. We will conduct a question-and-answer session after the opening remarks. Instructions will follow at that time. A replay of the conference call will be accessible anytime during the next week by dialing +1 (888) 660-6.34 thousand. Or +1 (646) 517-4.15 thousand. And entering passcode 94.4 thousand. At this time, I will turn the call over to Gernot Ruppelt, chief executive officer of Ardmore Shipping.
Gernot Ruppelt: Good morning, and welcome to Ardmore Shipping's second quarter 26 earnings call. First, let me ask our President, Bart Kelleher to discuss forward-looking statements.
Bart Kelleher: Thanks, Gernot. Turning to slide 2. Please allow me to remind you that our discussion today contains forward-looking statements. Actual results may differ materially from those projected in the forward-looking statements. Additional information concerning factors that could cause the actual results to differ materially from those in the forward-looking statements is contained in the second quarter 26 earnings release which is available on our website. And now I will turn the call back to Gernot.
Gernot Ruppelt: Thank you, Bart. Let me outline the format of today's call, which you can see here on slide 3. First, I will give you a brief overview of our second quarter highlights, and how we are executing on our capital allocation policy. I will then hand over to Bart, who will cover the market outlook and update you on our financial and operating performance. Thereafter, I will conclude the presentation before opening up the call for questions. Now, turning to Slide 4, covering our earnings highlights. We are pleased to report another strong quarter for Ardmore. Adjusted earnings were 48.3 million or $1.18 per share. Market conditions remained positive throughout the second quarter and into the third. In addition to long-term sectoral trends, the continued disruption in The Middle East is driving higher refining margins and long-haul volumes. Boosting product tanker TCE rates. We are declaring a dividend of €0.79 per share in line with our policy of paying out 2/3 of adjusted earnings. And as announced during the quarter, we exercised options on 2 additional Handysize tanker newbuildings, at the same terms as agreed at the start of the year taking our total order to 4 vessels with deliveries beginning in late 28. Now turning to Slide 5. Where we highlight our TCE performance. Our second quarter TCE reflects favorable market conditions. And rates in the third quarter remain well above seasonal levels. Our MR tankers earned $51.9 thousand per day for the second quarter. So far in the third quarter, with 45% booked, MRs earned $29.6 thousand per day which represents a …