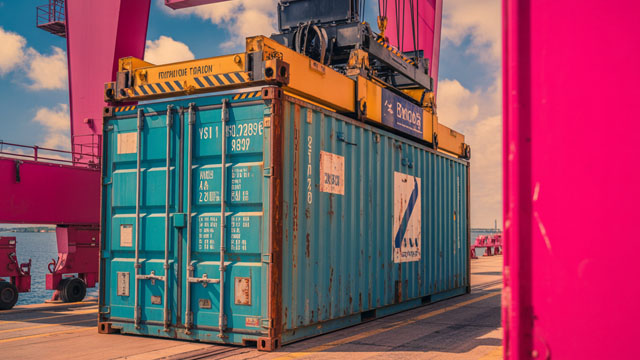
Costamare Inc. owns and operates containerships and dry bulk vessels worldwide. Its containerships are chartered to liner companies providing transportation of cargoes. ...
Costamare Inc. is a publicly traded maritime transportation and vessel-ownership company headquartered in Monaco, with important management and operating activities connected to Greece and the wider international shipping industry. The company traces its shipping roots to 1975, when Captain Vassilis C. Constantakopoulos founded Costamare Shipping Company S.A. Costamare Inc. was ...Costamare Inc. is a publicly traded maritime transportation and vessel-ownership company headquartered in Monaco, with important management and operating activities connected to Greece and the wider international shipping industry. The company traces its shipping roots to 1975, when Captain Vassilis C. Constantakopoulos founded Costamare Shipping Company S.A. Costamare Inc. was formed as a containership-owning company in 2008 and completed its initial public offering on the New York Stock Exchange in 2010. Konstantinos V. Konstantakopoulos, the founder's son, serves as Chairman and Chief Executive Officer and has led the company as CEO since 1998.
The company's core business is owning, acquiring, chartering, and managing commercial vessels. Its containership fleet is chartered primarily to liner companies, which use the vessels to transport containers containing manufactured goods, consumer products, industrial inputs, agricultural commodities, and other international cargo. Costamare also owns and charters dry bulk vessels. These ships transport commodities such as grain, coal, minerals, and other bulk cargoes for customers around the world. Based on the supplied company information, Costamare had approximately 79 containerships and 38 dry bulk vessels as of February 24, 2026, although investor materials and fleet counts can vary depending on the reporting date and whether vessels under construction, sold, or otherwise committed are included.
Costamare's revenue is generated mainly from vessel charter hire. The company generally incurs substantial costs for vessel acquisition, newbuilding investments, financing, interest expense, depreciation, insurance, maintenance, crew, technical management, dry-docking, regulatory compliance, and brokerage or commercial-management activities. The cost structure is capital intensive: ships represent the principal assets, while debt and equity financing are used to fund acquisitions and fleet renewal. Capital expenditure can therefore fluctuate significantly when the company purchases secondhand vessels, orders new ships, or performs major dry-dock work. Operating results are also sensitive to charter rates, vessel utilization, fuel and operating expenses, interest rates, ship values, trade volumes, port conditions, geopolitical events, and changes in environmental regulation.
The supplied trailing-period financial indicators show a business with substantial operating profitability, including an EBITDA margin of approximately 64.5 percent, an EBIT margin of approximately 48.2 percent, and a net profit margin of approximately 40.4 percent. The same data indicates meaningful leverage, with debt-to-equity of approximately 0.68 and net debt to EBITDA of approximately 2.11. Costamare also reported a trailing dividend of about $0.47 per share and a dividend yield of roughly 3.2 percent based on the supplied market data. These figures are market-data snapshots rather than guarantees of future performance.
Costamare's strategic objectives include maintaining a modern and commercially competitive fleet, securing attractive charter employment, preserving access to financing, managing leverage, returning capital to shareholders, and expanding selectively when vessel valuations and charter-market conditions are favorable. Its principal risks include cyclical shipping markets, charter-party counterparty risk, vessel obsolescence, environmental rules such as emissions requirements, refinancing needs, fluctuations in asset values, and global economic or geopolitical disruptions. The broader reported workforce is approximately 1,880 people, while some databases report only corporate or shore-based personnel; the larger figure generally reflects the company's wider maritime workforce.
YoYYoY means Year-over-Year. It compares the latest annual value with the previous annual value to show long-term trend strength.
QoQQoQ means Quarter-over-Quarter. It compares the latest quarter with the immediately previous quarter to show short-term momentum changes.
RevenueThe total money that came through the front door from selling things, before paying a single bill. Think of it as the grand total of every credit card swipe from customers. (YoY compares this year to last year's performance, while QoQ compares the current three months to the previous three).
$877.9M
-57.9%
-0.4%
Net IncomeThe absolute bottom line. If the company paid every single supplier, employee, banker, and tax collector, this is the actual money left in their pocket at the end of the day.
$364.6M
+14.0%
+2.8%
Gross MarginThe basic markup. If they sell a $100 pair of sneakers, this percentage tells you how much of that price tag is profit right after paying for the rubber and shoelaces, but before paying for things like store rent or TV commercials.
+57.3%
+114.4%
-0.0%
Operating MarginThe 'day job' efficiency score. Out of every dollar a customer spends, this shows how many cents the company keeps after making the product AND paying for all the everyday corporate overhead (like salaries, marketing, and keeping the lights on).
+51.7%
+133.1%
+2.5%
Net MarginThe final take-home percentage. When you strip away every conceivable cost, tax, and interest payment, this is the exact number of cents the company truly gets to keep from every dollar in sales.
+41.5%
+170.5%
+3.2%
Free Cash FlowThe holy grail of corporate cash. It's the spendable, physical money left over after the business pays for its daily operations AND buys the big, expensive upgrades (like new factories or servers) it needs to survive. This is the 'free' money they can use to pay dividends or buy back stock.
$472.3M
+83.6%
-1103.8%
FCF MarginThe ultimate cash conversion rate. It shows how good the company is at turning regular sales directly into cold, hard, spendable cash. A high percentage means the business is an absolute cash-printing machine.
+53.8%
+335.8%
-1107.9%
Debt / EquityThe financial risk gauge. It compares how much of the company's empire was built using borrowed money (loans) versus the owners' own money (shareholders). A high number means they are heavily leveraged and playing a riskier game; a low number means they are playing it safe.
72.6%
-22.4%
-2.3%
Current RatioThe 12-month survival check. It simply compares the cash they have right now (plus things they can quickly turn into cash) against the immediate bills they absolutely must pay this year. A score above 1 means they have enough in the wallet to cover the upcoming bills without panicking.
1.73x
+24.2%
-17.9%
Total AssetsThe absolute size of the company's empire. It bundles together absolutely everything of value they own—from the cash in the register and the inventory in the warehouse, to the software patents in the vault and the factories on the ground.
Operator: Thank you for standing by, ladies and gentlemen, and welcome to the Costamare Inc. Conference Call on the First Quarter 2026 Financial Results. We have with us Mr. Gregory Zikos, Chief Financial Officer of the company. I must advise you that this conference call is being recorded today, Wednesday, April 29, 2026. We would like to remind you that this conference call contains forward-looking statements. Please take a moment to read Slide #2 on the presentation, which contains the forward-looking statements. And I will now pass the floor over to your speaker today, Mr. Zikos. Please go ahead, sir.
Gregory Zikos: Thank you, and good morning, ladies and gentlemen. During the first quarter of the year, the company generated net income of about $75 million. Total liquidity amounted to about $645 million. Executing on our strategy of renewing the fleet and securing long-term cash flows from high-quality counterparties, we have ordered a total of 16 new buildings from first-class Chinese shipyards. 12 of the ships are 9,200 TEUs and four are 3,100 TEUs capacity. The vessels are expected to be delivered between the fourth quarter of 2027 and the second quarter of 2030. Upon delivery, all ships will commence long-term charters with COSCO shipping of 15 and 8 years for the 12 9,000 TEU ships and the four 3,100 TEU vessels, respectively. We are pleased to expand our value and long-lasting relationship with COSCO through the completion of our latest 16 newbuilding transaction. Incremental contracted revenues for the new charters amount to about $2.8 billion. The acquisitions will be funded with equity and debt. Pre and post-delivery financing for a tenure of up to 15 years has been arranged for all 16 ships with 2 leading Chinese financial institutions. In addition to the above, we have agreed to acquire 2 secondhand 5,600 TEU vessels built in 2001. The acquisitions are expected to be completed in Q4 '26, upon which each vessels shall commence a 42-month time charter with a leading liner operator. As a consequence, total contracted revenues have reached $6.2 billion with a remaining time charter duration of 6.1 years. In light of the above, management is pleased to recommend to the Board of Directors to increase the quarterly dividend per share from $0.115 to $0.125 while rewarding our shareholders as a result of increased cash flows, profitability and visibility, the payment of that dividend is not expected to affect our capacity to continue growing on a healthy basis in a volatile market environment. Moving now to the slide presentation. On the first slide, you can see our first quarter results. Adjusted net income for the quarter was $76 million or $0.63 per share. Net income for the quarter was $75 million or $0.62 per share. Our liquidity stands at about $640 million. Management has announced the intention to recommend a dividend increase to the Board. Subject to approval, the quarterly dividend would increase from $0.115 to $0.125 per share, …