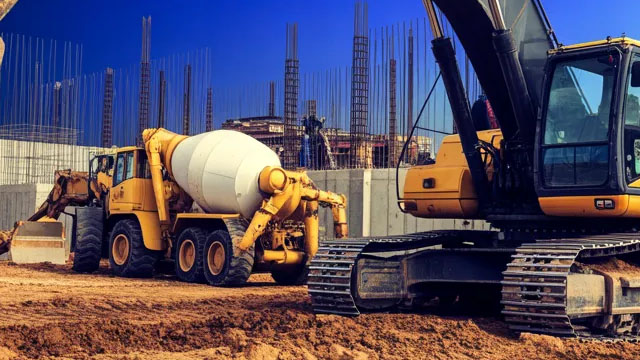
Operating globally, Terex Corporation specializes in the production and distribution of aerial work platforms and a diverse range of materials processing equipment. ...
Terex Corporation is a diversified global manufacturer headquartered in Norwalk, Connecticut, with a rich history dating back to 1933 when it was founded as Euclid Company by George Armington. The company is publicly traded on the New York Stock Exchange under the symbol TEX and has approximately 5,700 employees. Terex ...Terex Corporation is a diversified global manufacturer headquartered in Norwalk, Connecticut, with a rich history dating back to 1933 when it was founded as Euclid Company by George Armington. The company is publicly traded on the New York Stock Exchange under the symbol TEX and has approximately 5,700 employees. Terex specializes in producing and distributing aerial work platforms, telehandlers, utilities industry equipment, and materials processing machinery. Its operations are divided into two main segments: Aerial Work Platforms (AWP) and Materials Processing (MP). The AWP segment designs, manufactures, and markets access equipment under the Genie and Terex brands, including portable material lifts, aerial lifts, articulating and telescopic booms, scissor lifts, utility vehicles, and telehandlers. These products are used in construction and maintenance of industrial, commercial, and residential structures, as well as utility and telecommunication infrastructure. The MP segment offers a comprehensive portfolio of crushers, screening systems, trommels, feeders, material handlers, cranes, and concrete equipment under brands like Powerscreen, EvoQuip, Finlay, and Terex Washing Systems, serving industries such as quarrying, mining, recycling, and infrastructure development. Terex also provides financing options to support rental, leasing, and purchase of its equipment. Financially, the company has a market capitalization of approximately $7.74 billion, with a price-to-earnings ratio around 34 and a dividend yield of about 1%. The company focuses on delivering lifecycle solutions to maximize customer return on investment, emphasizing innovation and sustainability in its product offerings. Under the leadership of President and CEO Simon Meester, Terex continues to expand its global presence and operational efficiency.
YoYYoY means Year-over-Year. It compares the latest annual value with the previous annual value to show long-term trend strength.
QoQQoQ means Quarter-over-Quarter. It compares the latest quarter with the immediately previous quarter to show short-term momentum changes.
RevenueThe total money that came through the front door from selling things, before paying a single bill. Think of it as the grand total of every credit card swipe from customers. (YoY compares this year to last year's performance, while QoQ compares the current three months to the previous three).
$5.4B
+5.7%
+29.1%
Net IncomeThe absolute bottom line. If the company paid every single supplier, employee, banker, and tax collector, this is the actual money left in their pocket at the end of the day.
$221.0M
-34.0%
+223.6%
Gross MarginThe basic markup. If they sell a $100 pair of sneakers, this percentage tells you how much of that price tag is profit right after paying for the rubber and shoelaces, but before paying for things like store rent or TV commercials.
+19.4%
-6.9%
+67.0%
Operating MarginThe 'day job' efficiency score. Out of every dollar a customer spends, this shows how many cents the company keeps after making the product AND paying for all the everyday corporate overhead (like salaries, marketing, and keeping the lights on).
+8.8%
-14.6%
+276.7%
Net MarginThe final take-home percentage. When you strip away every conceivable cost, tax, and interest payment, this is the exact number of cents the company truly gets to keep from every dollar in sales.
+4.1%
-37.6%
+195.8%
Free Cash FlowThe holy grail of corporate cash. It's the spendable, physical money left over after the business pays for its daily operations AND buys the big, expensive upgrades (like new factories or servers) it needs to survive. This is the 'free' money they can use to pay dividends or buy back stock.
$322.0M
+70.4%
+266.7%
FCF MarginThe ultimate cash conversion rate. It shows how good the company is at turning regular sales directly into cold, hard, spendable cash. A high percentage means the business is an absolute cash-printing machine.
+5.9%
+61.1%
+229.1%
Debt / EquityThe financial risk gauge. It compares how much of the company's empire was built using borrowed money (loans) versus the owners' own money (shareholders). A high number means they are heavily leveraged and playing a riskier game; a low number means they are playing it safe.
134.1%
-9.6%
-4.3%
Current RatioThe 12-month survival check. It simply compares the cash they have right now (plus things they can quickly turn into cash) against the immediate bills they absolutely must pay this year. A score above 1 means they have enough in the wallet to cover the upcoming bills without panicking.
2.30x
+6.2%
-1.2%
Total AssetsThe absolute size of the company's empire. It bundles together absolutely everything of value they own—from the cash in the register and the inventory in the warehouse, to the software patents in the vault and the factories on the ground.
Operator: Greetings, and welcome to the Terex Second Quarter 2026 Results Conference Call. As a reminder, this conference is being recorded. It is now my pleasure to introduce your host, Drew Konop, Vice President of Investor Relations.
Drew Konop: Good morning, and welcome to the Terex Second Quarter 2026 Earnings Conference Call. A copy of the press release and presentation slides are posted on our Investor Relations website at investors.terex.com. In addition, the replay and slide presentation will be available on our website. We are joined today by Simon Meester, President and Chief Executive Officer; and Jennifer Kong, Senior Vice President and Chief Financial Officer. Their prepared remarks will be followed by Q&A. Please turn to Slide 2 of the presentation, which reflects our safe harbor statement. Today's conference call contains forward-looking statements, which are subject to risks that could cause actual results to be materially different from those expressed or implied. These risks are described in greater detail in our earnings materials and in reports filed with the SEC. On this call, we will be discussing non-GAAP financial information, including adjusted figures that we believe are useful in evaluating the company's operating performance. Reconciliations for these non-GAAP measures can be found in the conference call materials. Please turn to Slide 3, and I'll hand it over to Simon.
Simon Meester: Thanks, Drew. Good morning, and thank you for joining us today. Terex delivered a strong second quarter with revenue of $2.2 billion, increasing 8.5% compared to last year on a pro forma basis. The quarter's performance reflects revenue growth in all segments, improved earnings conversion and progress against the strategic priorities we've laid out in the past 2 years. Today, I'll begin with our consolidated performance and the demand backdrop we are seeing across the portfolio. I'll then discuss how each segment is executing against those market conditions before providing an update to our full year guidance, and Jen will then take you through the detailed financials. At the consolidated level, second quarter performance was supported by revenue growth and improved earnings conversion, both sequentially and year-over-year. Adjusted EBITDA of $269 million increased $26 million or 10.7% versus last year on a pro forma basis, driven by meaningful improvements, especially in the Materials Processing and Specialty Vehicles segments. Bookings increased 25% year-over-year on a pro forma basis. Our backlog of $6.9 billion provides solid coverage and supports our confidence in the second half and today's updated full year outlook. From a macro perspective, the demand environment for our business is positive and improving in many of our verticals. U.S. nonresidential construction is benefiting from the ongoing transition of planned projects to new starts, supporting demand across multiple segments. Year-to-date, U.S. nonresidential …