Zacks Investment Research8/10/2026Neutral
Deere (DE) Registers a Bigger Fall Than the Market: Important Facts to Note
In the most recent trading session, Deere (DE) closed at $609.28, indicating a -1.86% shift from the previous trading day.
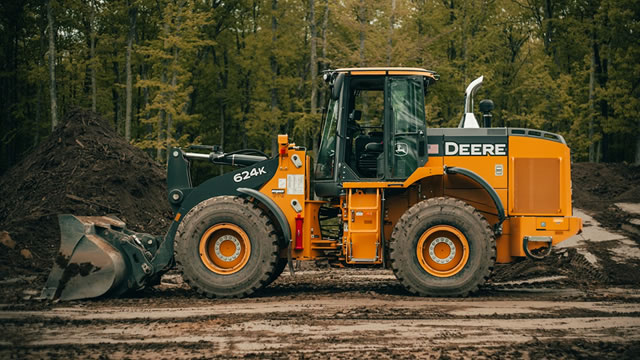
Deere & Company is a global manufacturer and distributor of a wide range of equipment. The company's operations are organized into four ...
Plutux is not an investment adviser. Market data and AI-generated analysis are for information and education only, not investment advice. Disclaimer
Operator: Good morning, and welcome to Deer and Company Third Quarter Earnings Conference Call. I would now like to turn the call over to Mr. Christopher Seibert, director of investor relations. Thank you. You may begin. Christopher Seibert: Hello. Welcome, and thank you for joining us on today's call. Joining me on the call today are Brent Norwood, Chief Financial Officer Deanna Kovar, President, Worldwide Agriculture and Turf Division, Production and Precision Ag, Sales and Marketing, Regions of the Americas and Australia. And Joshua Jepsen, Manager, Investor Communications. Today, we will take a closer look at Deere's third quarter earnings, then spend some time talking about our end markets, our current outlook for fiscal 2026. After that, we will respond to your questions. Please note that slides are available to complement the call this morning. They can be accessed on our website at johndeere.com/earnings. First, a reminder, this call is broadcast live on the Internet and recorded for future transmission and use by Deere and Company. Any other use, recording, or transmission of any portion of this copyrighted broadcast without the express written consent of Deere is strictly prohibited. Participants in the call including the Q&A session, agree that their likeness and remarks in all media may be stored and used as part of the earnings call. This call includes forward-looking statements concerning the company's plans and projections for the future. That are subject to uncertainties, risks, changes in circumstances, and other factors that are difficult to predict. Additional information concerning factors that could cause actual results to differ materially is contained in the company's most recent Form 8-Ks, risk factors in the annual Form 10-Ks, as updated by reports filed with the Securities and Exchange Commission. This call also may include financial measures that are not in conformance with accounting principles generally accepted in the United States of America. GAAP. Additional information concerning these measures including reconciliations to comparable GAAP measures, is included in the release and posted on our website at johndeere.com/earnings. Under quarterly earnings and events. I will now turn the call over to Christopher Seibert. Unidentified Speaker: Good morning, and thank you for joining us. John Deere delivered a strong third quarter. With equipment operations achieving 14.4% operating margin. While conditions vary across our end markets, we continue to see pockets of strength in agriculture, producers remain focused on managing profitability. Impacted by fluctuating commodity fundamentals and uncertainty around input costs and crop demand. All of which are influencing capital spending decisions by region. At the same time, construction, compact construction, and turf markets remain supported by healthy, project activity and steady demand fundamentals. Reinforcing the value of Deere's diversified portfolio. Against this …
| Metric | Latest | YoYYoY means Year-over-Year. It compares the latest annual value with the previous annual value to show long-term trend strength. | QoQQoQ means Quarter-over-Quarter. It compares the latest quarter with the immediately previous quarter to show short-term momentum changes. |
|---|---|---|---|
| The total money that came through the front door from selling things, before paying a single bill. Think of it as the grand total of every credit card swipe from customers. (YoY compares this year to last year's performance, while QoQ compares the current three months to the previous three). |
| Name | Title | Compensation | Gender | Year Born | Status |
|---|---|---|---|---|---|
John C. May | Chairman, President & Chief Executive Officer | USD 8,282,891 | Male | 1969 | Active |
Deanna Kovar | President of Worldwide Ag & Turf Div, Production and Precision Ag and Americas and Australia |
| USD 2,926,661 |
| Female |
| 1979 |
| Active |
Ryan D. Campbell | President of Worldwide Construction, Forestry & Power Systems | USD 2,870,301 | Male | 1975 | Active |
T. Brent Norwood | Senior Vice President & Chief Financial Officer | USD 2,729,580 | Male | 1982 | Active |
Christopher Seibert | Director of Investor Relations | — | — | — | Active |
Renee A. Mailhot | Vice President & Chief Compliance Officer | — | Female | — | Active |
J. Penn | Chief Economist | — | — | — | Active |
Felecia J. Pryor | Senior Vice President & Chief People Officer | — | Female | 1975 | Active |
Andrew C. Traeger | Chief Risk Officer & Senior VP of International Business at John Deere Financial | — | Male | — | Active |
Jahmy J. Hindman | Senior Vice President & Chief Technology Officer | — | Male | 1976 | Active |
Est. EPS $18.13 · Revenue $41.43B · 17 analysts
$6.48 per share
Est. EPS $3.35 · Revenue $8.64B · 8 analysts
| $44.7B |
| -11.6% |
| -5.7% |
| Net IncomeThe absolute bottom line. If the company paid every single supplier, employee, banker, and tax collector, this is the actual money left in their pocket at the end of the day. | $5.0B | -29.2% | -22.2% |
| Gross MarginThe basic markup. If they sell a $100 pair of sneakers, this percentage tells you how much of that price tag is profit right after paying for the rubber and shoelaces, but before paying for things like store rent or TV commercials. | +36.5% | -5.5% | -3.0% |
| Operating MarginThe 'day job' efficiency score. Out of every dollar a customer spends, this shows how many cents the company keeps after making the product AND paying for all the everyday corporate overhead (like salaries, marketing, and keeping the lights on). | +18.8% | -16.7% | -8.5% |
| Net MarginThe final take-home percentage. When you strip away every conceivable cost, tax, and interest payment, this is the exact number of cents the company truly gets to keep from every dollar in sales. | +11.3% | -19.9% | -17.5% |
| Free Cash FlowThe holy grail of corporate cash. It's the spendable, physical money left over after the business pays for its daily operations AND buys the big, expensive upgrades (like new factories or servers) it needs to survive. This is the 'free' money they can use to pay dividends or buy back stock. | $3.2B | -27.0% | +122.3% |
| FCF MarginThe ultimate cash conversion rate. It shows how good the company is at turning regular sales directly into cold, hard, spendable cash. A high percentage means the business is an absolute cash-printing machine. | +7.2% | -17.5% | +135.7% |
| Debt / EquityThe financial risk gauge. It compares how much of the company's empire was built using borrowed money (loans) versus the owners' own money (shareholders). A high number means they are heavily leveraged and playing a riskier game; a low number means they are playing it safe. | 246.4% | -14.1% | -2.1% |
| Current RatioThe 12-month survival check. It simply compares the cash they have right now (plus things they can quickly turn into cash) against the immediate bills they absolutely must pay this year. A score above 1 means they have enough in the wallet to cover the upcoming bills without panicking. | 2.31x | +8.2% | -2.4% |
| Total AssetsThe absolute size of the company's empire. It bundles together absolutely everything of value they own—from the cash in the register and the inventory in the warehouse, to the software patents in the vault and the factories on the ground. | $106.0B | -1.2% | +0.6% |
| Metric | Annual (A vs E) | Annual Surprise | Quarter (A vs E) | Quarter Surprise |
|---|---|---|---|---|
| EPS Surprise | 18.50 vs 18.42 | +0.4% | 5.10 vs 4.69 | +8.6% |
| Revenue Surprise | $44.7B vs $38.3B | +16.7% | $12.6B vs $10.8B | +16.6% |
| Date | Executive | Title | Security | Side | Shares | Price |
|---|---|---|---|---|---|---|
| Dec 10, 2026 | Norwood Terry Brent | officer: Sr VP & CFO | Market Priced Employee Stock Options | — | 629 | $468.90 |
| Aug 31, 2026 | CAMPBELL RYAN D | officer: Pres WWC&F and Pwr Systems | $1 Par Common Stock | A | 957 | $377.01 |
| Aug 31, 2026 | CAMPBELL RYAN D | officer: Pres WWC&F and Pwr Systems | $1 Par Common Stock | A | 1,049 | $438.44 |
| Aug 31, 2026 | CAMPBELL RYAN D | officer: Pres WWC&F and Pwr Systems | $1 Par Common Stock | A | 1,775 | $343.94 |
| Aug 31, 2026 | CAMPBELL RYAN D | officer: Pres WWC&F and Pwr Systems | $1 Par Common Stock | D | 2,929 | $650.18 |