
Seeking Alpha8/13/2026Neutral
BBB Foods Inc. (TBBB) Q2 2026 Earnings Call Transcript
BBB Foods Inc. (TBBB) Q2 2026 Earnings Call Transcript

Through its various subsidiaries, BBB Foods Inc. manages a network of grocery retail outlets throughout Mexico. The company provides a comprehensive selection ...
Plutux is not an investment adviser. Market data and AI-generated analysis are for information and education only, not investment advice. Disclaimer
Est. EPS $-10.79 · Revenue $107.38B · 3 analysts
Est. EPS $-1.06 · Revenue $139.07B · 3 analysts
Est. EPS $0.00 · Revenue $51.47B · 1 analysts
Est. EPS $0.00 · Revenue $57.41B · 1 analysts
EPS MXN -3.32 · Revenue MXN 26.16B
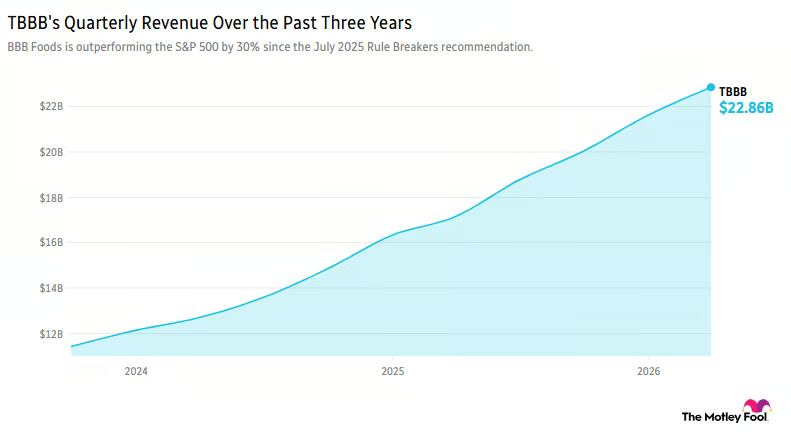
EPS MXN -4.76 · Revenue MXN 22.86B
EPS MXN -23.23 · Revenue MXN 73.30B
EPS MXN -12.19 · Revenue MXN 20.04B
EPS MXN -2.50 · Revenue MXN 18.77B
EPS MXN -0.76 · Revenue MXN 17.13B
| Metric | Latest | YoYYoY means Year-over-Year. It compares the latest annual value with the previous annual value to show long-term trend strength. | QoQQoQ means Quarter-over-Quarter. It compares the latest quarter with the immediately previous quarter to show short-term momentum changes. |
|---|---|---|---|
| RevenueThe total money that came through the front door from selling things, before paying a single bill. Think of it as the grand total of every credit card swipe from customers. (YoY compares this year to last year's performance, while QoQ compares the current three months to the previous three). | $73.3B | +27.6% | +14.4% |
| Net IncomeThe absolute bottom line. If the company paid every single supplier, employee, banker, and tax collector, this is the actual money left in their pocket at the end of the day. | $-2.7B | -896.4% | +30.5% |
| Gross MarginThe basic markup. If they sell a $100 pair of sneakers, this percentage tells you how much of that price tag is profit right after paying for the rubber and shoelaces, but before paying for things like store rent or TV commercials. | +16.2% | -0.9% | +3.4% |
| Operating MarginThe 'day job' efficiency score. Out of every dollar a customer spends, this shows how many cents the company keeps after making the product AND paying for all the everyday corporate overhead (like salaries, marketing, and keeping the lights on). | -0.7% | -131.7% | +1700.6% |
| Net MarginThe final take-home percentage. When you strip away every conceivable cost, tax, and interest payment, this is the exact number of cents the company truly gets to keep from every dollar in sales. | -3.6% | -724.1% | +39.2% |
| Free Cash FlowThe holy grail of corporate cash. It's the spendable, physical money left over after the business pays for its daily operations AND buys the big, expensive upgrades (like new factories or servers) it needs to survive. This is the 'free' money they can use to pay dividends or buy back stock. | $1.1B | -13.6% | +11.5% |
| FCF MarginThe ultimate cash conversion rate. It shows how good the company is at turning regular sales directly into cold, hard, spendable cash. A high percentage means the business is an absolute cash-printing machine. | +1.5% | -32.3% | -2.6% |
| Debt / EquityThe financial risk gauge. It compares how much of the company's empire was built using borrowed money (loans) versus the owners' own money (shareholders). A high number means they are heavily leveraged and playing a riskier game; a low number means they are playing it safe. | 338.9% | +48.6% | -22.1% |
| Current RatioThe 12-month survival check. It simply compares the cash they have right now (plus things they can quickly turn into cash) against the immediate bills they absolutely must pay this year. A score above 1 means they have enough in the wallet to cover the upcoming bills without panicking. | 0.62x | -18.5% | +12.5% |
| Total AssetsThe absolute size of the company's empire. It bundles together absolutely everything of value they own—from the cash in the register and the inventory in the warehouse, to the software patents in the vault and the factories on the ground. | $30.6B | +34.2% | +14.1% |
| Metric | Annual (A vs E) | Annual Surprise | Quarter (A vs E) | Quarter Surprise |
|---|---|---|---|---|
| EPS Surprise | -23.23 vs -19.63 | -18.4% | — | — |
| Revenue Surprise | $73.3B vs $77.8B | -5.8% | $26.2B vs $51.5B | -49.2% |
| Date | Executive | Title | Security | Side | Shares | Price |
|---|---|---|---|---|---|---|
| Aug 7, 2026 | Hatoum Kamal Anthony | director, officer: Chairman & CEO | Class A Common Shares | A | 16,003,914 | — |
| Aug 7, 2026 | Hatoum Kamal Anthony | director, officer: Chairman & CEO | Class C Common Shares | D | 16,003,914 | — |
| Aug 7, 2026 | Reich Sapire Rose Nicole Dominique | director | Stock Options (Right to Buy) | D | 20,000 | $9.67 |
| Aug 7, 2026 | Reich Sapire Rose Nicole Dominique | director | Class A Common Shares | A | 20,000 | $9.67 |
| Aug 7, 2026 | Reich Sapire Rose Nicole Dominique | director | Class A Common Shares | D | 4,754 | $40.67 |
Operator: Good morning, everyone. My name is Daniela, and I will be your conference operator. Welcome to Tiendas 3B's second quarter 2026 conference call. All lines have been placed on mute to prevent any background noise. There will be a question and answer session after the speaker's remarks, and instructions will be given at that time. Please ensure that your full name is displayed correctly on Zoom. If not, please take a moment to edit your display name. Also note that this call is for investors and analysts only. Questions from the media will not be taken, nor should the call be reported on. Any forward-looking statements made during this conference call are based on information that is currently available to us. Today, we are joined by Tiendas 3B's Chairman and Chief Executive Officer, Anthony Hatoum, and Chief Financial Officer, Eduardo Pizzuto. I will now turn the call over to Anthony. Please go ahead. Anthony Hatoum: Good morning, and thank you for joining us today. I will begin with a review of our operating results for the quarter, and will be followed by our CFO, Eduardo Pizzuto, who will provide an overview of our financial performance. We will conclude with our Q&A session. We delivered another strong quarter, sustaining and even building on the momentum we achieved in the first quarter. Here are the key highlights from our second quarter results. We opened 155 net new stores during the quarter, bringing our total store count to 3,624 as of June 30, 2026. Over the last 12 months, we have opened 593 net new stores. We also opened one new distribution center, expanding our network to 21 regions as of the end of June. Same-store sales grew 20% compared to the second quarter of 2025. Total revenue increased 39% year-over-year to MXN 26 billion. Reported EBITDA reached MXN 960 million. Excluding non-cash share-based compensation, EBITDA increased 44% to MXN 1.6 billion. For the first half of the year, cash flow generated from operating activities reached MXN 4.3 billion, representing 119% growth compared to the first half of 2025. Let's now turn to our operational performance. As I mentioned, we opened 155 net new stores during the second quarter. Over the last 12 months, we have opened 593 net new stores, representing 20% growth in our store base compared to June 2025. Our expansion strategy remains unchanged. We continue to balance densifying our presence in existing regions while selectively expanding our footprint in others. Our revenue growth remained exceptionally strong, and we believe 3B continues to be amongst the fastest-growing retailers globally. Total revenue reached MXN 26 billion in the second quarter, up 39% year-over-year. Same-store sales increased 20%, reflecting another quarter of outstanding performance. This strong growth continues to be driven by ongoing improvements to our value proposition, increasing brand awareness, and growing customer loyalty. Our same-store sales performance continued to significantly …
| Name | Title | Gender | Year Born | Status |
|---|---|---|---|---|
Eduardo Pizzuto | Chief Financial Officer & Investor Relations Officer | Male | 1971 | Active |
Javier Suarez | Director of Human Resources | Male | 1977 | Active |
Luis Bermúdez | Director of Purchasing | Male | 1971 | Active |
Pablo Grattarola | Director of Information Technology | Male | 1973 | Active |
Amparo Martínez Ruiz | General Counsel | Female | 1979 | Active |
Kamal Anthony Hatoum | Founder, Chief Executive Officer & Chairman | Male | 1964 | Active |
Diego Apalategui | Director of Sales & Operations | Male | 1977 | Active |
Alejandro Davila | Director of Real Estate | Male | 1978 | Active |
BBB Foods Inc. (TBBB) Q2 2026 Earnings Call Transcript
Sales and adjusted EBITDA rose 39% and 44% during the second quarter. This revenue growth wasn't just expansion-driven, as same-store sales also increased by 20%.
TBBB rallies on strong expansion, Anthropic could IPO with $2 trillion valuation, and more
Although the revenue and EPS for BBB Foods (TBBB) give a sense of how its business performed in the quarter ended June 2026, it might be worth considering how some key metrics compare with Wall Street estimates and the year-ago numbers.
BBB Foods (TBBB) came out with a quarterly loss of $0.19 per share versus the Zacks Consensus Estimate of a loss of $0.18. This compares to a loss of $0.13 per share a year ago.