Five Below, Inc. operates as a prominent specialty discount retailer primarily serving the United States market. The company's diverse inventory spans a ...
Five Below, Inc. is a prominent specialty discount retailer that has carved a niche in the value retail segment by offering a diverse assortment of products, most priced at $5 or below, with a selection of extreme value items exceeding that price point. Founded on October 4, 2002, in Wayne, ...Five Below, Inc. is a prominent specialty discount retailer that has carved a niche in the value retail segment by offering a diverse assortment of products, most priced at $5 or below, with a selection of extreme value items exceeding that price point. Founded on October 4, 2002, in Wayne, PA, by Tom Vellios and David Schlessinger, the company was initially named Cheap Holdings, Inc. and later rebranded to Five Below in August 2002. Headquartered in Philadelphia, Pennsylvania, the company has grown significantly since its IPO in July 2012, expanding its store footprint to over 1,500 locations across the United States, with plans for continued growth. The company's target demographic includes tweens, teens, and young adults, but its appeal extends to a broader customer base seeking affordable, trend-right merchandise.
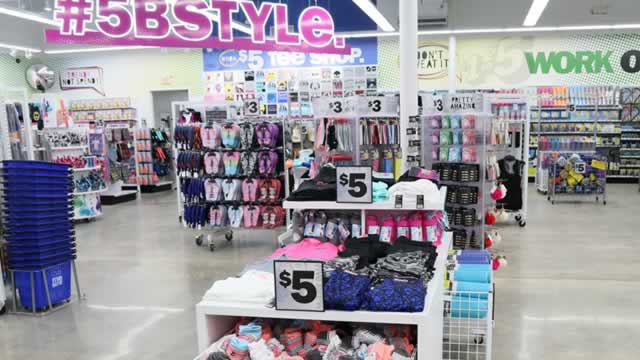
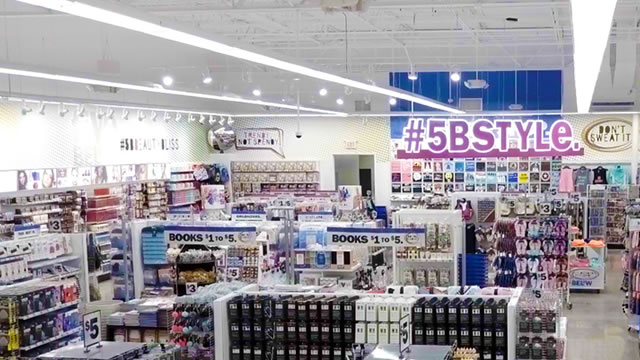
Business and Products: Five Below operates as a specialty value retailer, with a store layout designed around eight 'worlds': Style, Room, Sports, Tech, Create, Party, Candy, and Now. This structure allows customers to easily navigate through categories such as fashion accessories (sunglasses, jewelry, scarves, athletic apparel), beauty products (nail polish, lip gloss, cosmetics), home décor (lamps, posters, picture frames, candles), sports and fitness equipment (balls, hand weights, yoga mats), games and toys (board games, puzzles, remote-control toys), technology accessories (phone cases, chargers, headphones), arts and crafts (kits, crayons, markers), school supplies (backpacks, notebooks), party goods (decorations, gag gifts), and candy and snacks. The 'Now' world offers a rotating selection of seasonal and trendy items, keeping the product assortment fresh and exciting.
Pricing and Value Proposition: The core value proposition is 'extreme value,' with most items priced between $1 and $5, and a smaller assortment of items priced up to $25 for larger or more specialized products. This pricing strategy positions Five Below as a destination for budget-conscious consumers, particularly during economic downturns when discretionary spending is tight. The company emphasizes 'let go and have fun,' creating an in-store experience that is visually engaging and interactive, encouraging impulse purchases and repeat visits.
Financial Performance: As of the latest available data, Five Below's market capitalization stands at approximately $13.5 billion, with a stock price of $244.37. The company has demonstrated robust financial health, with revenue per share of $91.91 and a net profit margin of 8.7%. Its gross profit margin is 34.8%, indicating efficient cost management. The company has a low debt-to-equity ratio of 0.864, suggesting a conservative capital structure. Five Below does not pay dividends, instead reinvesting profits into expansion and growth. The company's enterprise value-to-EBITDA ratio is 18.99, reflecting investor expectations of future growth. Key financial metrics include a return on equity of 21.1% and a return on assets of 8.7%, showcasing effective use of capital.
Key People: The current CEO, Winnie Park, was appointed effective December 16, 2024, bringing extensive retail experience from her previous roles. The founders, Tom Vellios and David Schlessinger, laid the groundwork for the company's success. Joel Anderson, who served as CEO from 2014 to 2024, led the company through a period of significant expansion, including reaching $1 billion in annual sales in 2016. The leadership team focuses on strategic store growth, product innovation, and operational efficiency.
Operational and Expansion Strategy: Five Below has a clear growth strategy, aiming to have at least 3,000 stores in the United States by 2030. The company's average store size is approximately 8,000 square feet, allowing for efficient utilization of retail space. The company has a strong supply chain and inventory management, with an inventory turnover of 4.07 times and a cash conversion cycle of 50.92 days, indicating effective working capital management. Five Below also invests in its e-commerce platform, fivebelow.com, to complement its brick-and-mortar presence, offering convenient online shopping with options for in-store pickup.
Corporate Social Responsibility: The company is committed to community engagement and sustainability. Five Below has initiatives to reduce its environmental footprint, including energy-efficient store designs and recycling programs. Additionally, the company supports local communities through charitable donations and employee volunteer programs.
In summary, Five Below, Inc. is a dynamic and rapidly growing player in the discount retail sector, known for its value proposition, engaging shopping experience, and strategic expansion. With a strong financial foundation, a clear growth trajectory, and a commitment to customer satisfaction, Five Below is well-positioned to continue its success in the competitive retail market.
YoYYoY means Year-over-Year. It compares the latest annual value with the previous annual value to show long-term trend strength.
QoQQoQ means Quarter-over-Quarter. It compares the latest quarter with the immediately previous quarter to show short-term momentum changes.
RevenueThe total money that came through the front door from selling things, before paying a single bill. Think of it as the grand total of every credit card swipe from customers. (YoY compares this year to last year's performance, while QoQ compares the current three months to the previous three).
$4.8B
+22.9%
-25.6%
Net IncomeThe absolute bottom line. If the company paid every single supplier, employee, banker, and tax collector, this is the actual money left in their pocket at the end of the day.
$358.6M
+41.4%
-48.3%
Gross MarginThe basic markup. If they sell a $100 pair of sneakers, this percentage tells you how much of that price tag is profit right after paying for the rubber and shoelaces, but before paying for things like store rent or TV commercials.
+32.0%
-8.4%
-11.3%
Operating MarginThe 'day job' efficiency score. Out of every dollar a customer spends, this shows how many cents the company keeps after making the product AND paying for all the everyday corporate overhead (like salaries, marketing, and keeping the lights on).
+9.6%
+14.9%
-33.3%
Net MarginThe final take-home percentage. When you strip away every conceivable cost, tax, and interest payment, this is the exact number of cents the company truly gets to keep from every dollar in sales.
+7.5%
+15.1%
-30.6%
Free Cash FlowThe holy grail of corporate cash. It's the spendable, physical money left over after the business pays for its daily operations AND buys the big, expensive upgrades (like new factories or servers) it needs to survive. This is the 'free' money they can use to pay dividends or buy back stock.
$411.7M
+286.0%
-52.5%
FCF MarginThe ultimate cash conversion rate. It shows how good the company is at turning regular sales directly into cold, hard, spendable cash. A high percentage means the business is an absolute cash-printing machine.
+8.6%
+214.1%
-36.1%
Debt / EquityThe financial risk gauge. It compares how much of the company's empire was built using borrowed money (loans) versus the owners' own money (shareholders). A high number means they are heavily leveraged and playing a riskier game; a low number means they are playing it safe.
92.7%
-15.4%
-6.7%
Current RatioThe 12-month survival check. It simply compares the cash they have right now (plus things they can quickly turn into cash) against the immediate bills they absolutely must pay this year. A score above 1 means they have enough in the wallet to cover the upcoming bills without panicking.
2.01x
+12.5%
+4.4%
Total AssetsThe absolute size of the company's empire. It bundles together absolutely everything of value they own—from the cash in the register and the inventory in the warehouse, to the software patents in the vault and the factories on the ground.
Operator: Good day, and welcome to the Five Below First Quarter 2026 Earnings Conference Call. [Operator Instructions] Please note this event is being recorded. I would now like to turn the conference over to Ms. Christiane Pelz, Vice President and Investor Relations. Please go ahead, ma'am.
Christiane Pelz: Thank you, operator. Good afternoon, everyone, and thanks for joining us today for Five Below's First Quarter 2026 Financial Results Conference Call. On today's call are Winnie Park, Chief Executive Officer; and Dan Sullivan, Chief Financial Officer and Treasurer. After management has made their formal remarks, we will open the call to questions. Certain comments made during this call may constitute forward-looking statements. Such forward-looking statements are subject to risks and uncertainties that could cause actual results to differ materially from such statements, including those described in the press release and our SEC filings. In this presentation, we will refer to our SG&A expenses, which for us includes depreciation and amortization. Additionally, we will be discussing certain non-GAAP financial measures. Please review today's press release, which is posted on our Investor Relations website for a reconciliation of these items to the most directly comparable U.S. GAAP measure and a cautionary statement regarding forward-looking statements. I will now turn the call over to Winnie.
Winifred Park: Thank you, Christiane, and hello, all. I want to start by saying how grateful I am to our amazing Five Below crew. They have executed our strategy at an exceptional level by staying laser-focused on what matters most, the customer, our box. Our first quarter results are a testament to their great work, which reflects our operating flywheel in action and demonstrates the traction we've made in transforming our business and strengthening our position as the destination for the kid and the kid in all of us. For the first quarter, we are reporting results that exceeded our expectations with sales growth of nearly 33% to $1.3 billion, driven by 23% comp growth and strong new store performance, including 49 net new stores that opened during the quarter. Adjusted EPS of $2.22 per share grew over 2.5x compared to the first quarter of last year. With this positive momentum and despite an expected more challenging macro environment as the year plays out, we are raising our full year outlook, which Dan will discuss shortly. Our outsized sales growth in the quarter was driven by 3 key factors: First, we continue to see the customer reacting favorably to our strategy and the changes we made to our operating model. We often talk about the 3 legs of the stool that support our unique value proposition. The first leg is curated product storytelling focused on newness and amazing value across our assortment. Second, meeting the customer where they are with relevant marketing and social and digital media. Third, easier and funner shopping experiences in our …