Zacks Investment Research8/18/2026Neutral
Bear of the Day: Boston Beer Company (SAM)
With American alcohol consumption near historic lows, Boston Beer Company is fighting an uphill battle.
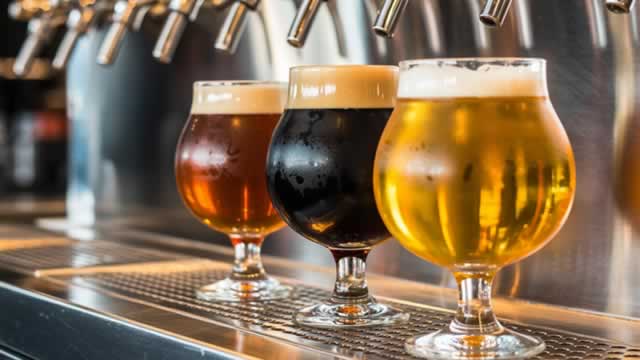
The Boston Beer Company, Inc. is a leading producer and marketer of alcoholic beverages, primarily focused on the United States market. Its ...
Plutux is not an investment adviser. Market data and AI-generated analysis are for information and education only, not investment advice. Disclaimer
Est. EPS $4.34 · Revenue $524.22M · 7 analysts
Est. EPS $9.01 · Revenue $1.92B · 7 analysts
Est. EPS $1.90 · Revenue $436.68M · 5 analysts
Est. EPS $4.55 · Revenue $572.47M · 4 analysts
EPS $2.16 · Revenue $453.87M
| Metric | Latest | YoYYoY means Year-over-Year. It compares the latest annual value with the previous annual value to show long-term trend strength. | QoQQoQ means Quarter-over-Quarter. It compares the latest quarter with the immediately previous quarter to show short-term momentum changes. |
|---|---|---|---|
| RevenueThe total money that came through the front door from selling things, before paying a single bill. Think of it as the grand total of every credit card swipe from customers. (YoY compares this year to last year's performance, while QoQ compares the current three months to the previous three). | $2.1B | +3.7% | +40.1% |
| Net IncomeThe absolute bottom line. If the company paid every single supplier, employee, banker, and tax collector, this is the actual money left in their pocket at the end of the day. | $108.5M | +81.7% | +135.5% |
| Gross MarginThe basic markup. If they sell a $100 pair of sneakers, this percentage tells you how much of that price tag is profit right after paying for the rubber and shoelaces, but before paying for things like store rent or TV commercials. | +45.6% | +2.8% | -4.4% |
| Operating MarginThe 'day job' efficiency score. Out of every dollar a customer spends, this shows how many cents the company keeps after making the product AND paying for all the everyday corporate overhead (like salaries, marketing, and keeping the lights on). | +6.9% | +83.9% | +134.1% |
| Net MarginThe final take-home percentage. When you strip away every conceivable cost, tax, and interest payment, this is the exact number of cents the company truly gets to keep from every dollar in sales. | +5.2% | +75.2% | +125.3% |
| Free Cash FlowThe holy grail of corporate cash. It's the spendable, physical money left over after the business pays for its daily operations AND buys the big, expensive upgrades (like new factories or servers) it needs to survive. This is the 'free' money they can use to pay dividends or buy back stock. | $215.6M | +24.9% | +489.1% |
| FCF MarginThe ultimate cash conversion rate. It shows how good the company is at turning regular sales directly into cold, hard, spendable cash. A high percentage means the business is an absolute cash-printing machine. | +10.3% | +20.5% | +377.8% |
| Debt / EquityThe financial risk gauge. It compares how much of the company's empire was built using borrowed money (loans) versus the owners' own money (shareholders). A high number means they are heavily leveraged and playing a riskier game; a low number means they are playing it safe. | 4.5% | +5.7% | -13.3% |
| Current RatioThe 12-month survival check. It simply compares the cash they have right now (plus things they can quickly turn into cash) against the immediate bills they absolutely must pay this year. A score above 1 means they have enough in the wallet to cover the upcoming bills without panicking. | 1.65x | -8.2% | +12.3% |
| Total AssetsThe absolute size of the company's empire. It bundles together absolutely everything of value they own—from the cash in the register and the inventory in the warehouse, to the software patents in the vault and the factories on the ground. | $1.2B | -4.5% | +7.2% |
| Metric | Annual (A vs E) | Annual Surprise | Quarter (A vs E) | Quarter Surprise |
|---|---|---|---|---|
| EPS Surprise | 9.89 vs 9.35 | +5.8% | 4.96 vs 4.34 | +14.2% |
| Revenue Surprise | $2.1B vs $2.0B | +6.2% | $607.8M vs $524.2M | +15.9% |
| Date | Executive | Title | Security | Side | Shares | Price |
|---|---|---|---|---|---|---|
| May 27, 2026 | Stone Christopher Isaac | director | Class A Common | A | 358 | — |
| May 27, 2026 | Stone Christopher Isaac | director | May 27, 2027 Stock Option | A | 691 | $181.63 |
| May 27, 2026 | JORDAN JOSEPH HUGH | director | Class A Common | A | 358 | — |
| May 27, 2026 | JORDAN JOSEPH HUGH | director | May 27, 2026 Stock Option | A | 691 | $181.63 |
| May 27, 2026 | Swanson Cynthia | director | Class A Common | A | 358 | — |
Operator : Greetings, and welcome to the Boston Beer Company's Second Quarter 2026 Earnings Call. As a reminder, this conference is being recorded. It's now my pleasure to introduce Mike Andrews, Associate General Counsel and Corporate Secretary. Please go ahead. Michael Andrews : Thank you. Good afternoon, and welcome. This is Mike Andrews, Associate General Counsel and Corporate Secretary of the Boston Beer Company. I'm pleased to kick off our 2026 second quarter earnings call. Joining the call from Boston Beer are Jim Koch, Founder, CEO and Chairman; and Diego Reynoso, our CFO. Before we discuss our business, I'll start with our disclaimer. As we stated in our earnings release, some of the information we discuss and that may come up on this call reflects the company's or management's expectations or predictions of the future. Such predictions are forward-looking statements. It is important to note that the company's actual results could differ materially from those projected in these forward-looking statements. Additional information concerning factors that could cause actual results to differ materially from those in the forward-looking statements is contained in the company's most recent 10-Q and 10-K. The company does not undertake to publicly update forward-looking statements, whether as a result of new information, future events or otherwise. I'll now pass over to Jim for introductory comments. C. Koch : Thanks, Mike. I'll begin my remarks this afternoon with an overview of our strategy and operating results before turning the call over to Diego to discuss our second quarter financial results and our financial outlook for the remainder of 2026. Immediately following Diego's comments, we will open the line for questions. In the first half, the overall beer market improved modestly, although demand was uneven throughout the period. The category was nearly flat in the first quarter before softening in the second quarter, with May proving particularly challenging. Trends improved in June as consumer demand benefited from increased drinking occasions around the World Cup and Americas 250th anniversary celebrations. We estimate the combined total beer and beyond beer market was down 2% in volume in the first half compared to a decline of 4% for the full year of 2025. Beyond Beer continues to outperform traditional beer in volume in measured off-premise channels decreasing 1% for the first half compared to traditional beer, which declined 4%. We anticipate industry volume headwinds for the remainder of 2026 as consumers remain under pressure from the cumulative effects of inflation and a significant increase in gas prices. With respect to Boston Beer portfolio volume trends, our performance continues to lag the pace of improvement in the broader category. In the second quarter, we delivered triple-digit depletion growth in Sun Cruiser, continued growth in Angry Orchard and strong on-premise results across the portfolio as major events …
| Name | Title | Compensation | Gender | Year Born | Status |
|---|---|---|---|---|---|
Philip A. Hodges | Chief Operating Officer | USD 1,205,086 | Male | 1966 | Active |
Diego Reynoso | Chief Financial Officer & Treasurer | USD 1,109,235 | Male | 1976 | Active |
Lesya Lysyj | Advisor | USD 893,166 | Female | 1963 | Active |
Laura J. Boynton | Chief People Officer | USD 869,102 | Female | 1976 | Active |
Michael R. Crowley | Chief Sales Officer | USD 714,202 | Male | 1970 | Active |
Tara L. Heath | Chief Legal Officer & General Counsel | USD 671,912 | Female | 1975 | Active |
Matthew Donal Murphy | Chief Accounting Officer & Vice President of Finance | USD 600,967 | Male | 1969 | Active |
Samuel A. Calagione | Founder, Brewer of Dogfish Head & Director | USD 493,076 | Male | 1970 | Active |
C. James Koch | Founder, Chairman, President & Chief Executive Officer | USD 5,695 | Male | 1950 | Active |
Paul Weaver | Director & Head of Cannabis | — | Male | — | Active |
With American alcohol consumption near historic lows, Boston Beer Company is fighting an uphill battle.
Shares of Starcore International Mines Ltd. (TSE: SAM - Get Free Report) passed above its fifty day moving average during trading on Thursday. The stock has a fifty day moving average of C$0.48 and traded as high as C$0.57. Starcore International Mines shares last traded at C$0.53, with a volume of 191,955 shares. Starcore International
Walden, N.Y., Aug. 11, 2026 (GLOBE NEWSWIRE) -- Most rec softball teams are looking for a good time, a reason to get outside, hang with friends and have a few drinks.
The iconic Boy Howdy! “beer” is no longer an imaginary ale, but a drinkable reality The iconic Boy Howdy! “beer” is no longer an imaginary ale, but a drinkable reality

With American alcohol consumption near historic lows, Boston Beer Company is fighting an uphill battle.