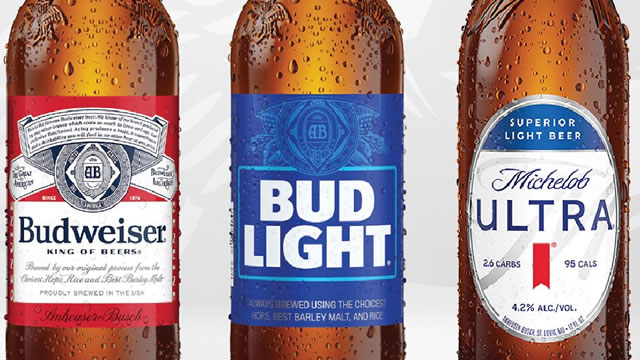
Anheuser-Busch InBev SA/NV (AB InBev), traded on the NYSE under the ticker BUD, is a global beverage producer whose core business is the manufacturing, marketing, and distribution of beer and a growing set of related alcoholic and non-alcoholic drinks. The company’s scale is reflected in its expansive brand portfolio—over 500 ...Anheuser-Busch InBev SA/NV (AB InBev), traded on the NYSE under the ticker BUD, is a global beverage producer whose core business is the manufacturing, marketing, and distribution of beer and a growing set of related alcoholic and non-alcoholic drinks. The company’s scale is reflected in its expansive brand portfolio—over 500 global and local labels—with several internationally recognized names such as Budweiser, Bud Light, Corona, and Stella Artois, alongside many regional brands. This breadth helps AB InBev participate in multiple consumer preferences, price tiers, and geographic markets.
From a product and operations perspective, AB InBev’s value chain is centered on brewing, packaging, and logistics. Its cost structure is typically influenced by commodity inputs (e.g., barley/malt and hops), packaging materials (glass, aluminum, paper/cardboard), and energy usage for brewing, steam, and refrigeration processes. Because beer production is capital- and process-intensive, factory utilization rates, supply planning, and packaging sourcing strategies can materially affect margins. AB InBev also relies heavily on large-scale distribution networks and long-established retailer/wholesaler relationships to move high-volume, relatively perishable products.
Commercially, the company competes through brand equity, marketing effectiveness, trade terms, and route-to-market execution. AB InBev’s strategy often includes portfolio management (investing in core brands while calibrating less profitable labels), innovation (including variations in taste, alcohol content, and formats), and expansion of non-alcoholic options, which can diversify demand and reduce seasonality sensitivity.
Financially, AB InBev operates as a mature large-cap consumer defensive business. With a very large global workforce (reported around 143,885 employees in 2024), the company benefits from economies of scale in procurement, manufacturing, and distribution. Market metrics provided (e.g., market capitalization and enterprise value) indicate a company valued as a steady, cash-generative operator, where capital allocation, cost discipline, and working-capital management are central to investor focus.
Key leadership includes CEO Michel Doukeris (AB InBev CEO since July 2021, and previously associated with leadership of Anheuser-Busch and North America). The company’s headquarters in Leuven, Belgium underscores its European roots while maintaining a truly global operating footprint across Americas, Europe, and beyond.
Wishes/goals in the public-purpose framing typically emphasize growth in beer and broader beverages, strong brand stewardship, and adapting to changing consumer tastes—alongside maintaining efficient manufacturing and sustainable sourcing practices to support long-term profitability.
YoYYoY means Year-over-Year. It compares the latest annual value with the previous annual value to show long-term trend strength.
QoQQoQ means Quarter-over-Quarter. It compares the latest quarter with the immediately previous quarter to show short-term momentum changes.
RevenueThe total money that came through the front door from selling things, before paying a single bill. Think of it as the grand total of every credit card swipe from customers. (YoY compares this year to last year's performance, while QoQ compares the current three months to the previous three).
$59.3B
-0.7%
+4.3%
Net IncomeThe absolute bottom line. If the company paid every single supplier, employee, banker, and tax collector, this is the actual money left in their pocket at the end of the day.
$6.8B
+16.8%
+110.1%
Gross MarginThe basic markup. If they sell a $100 pair of sneakers, this percentage tells you how much of that price tag is profit right after paying for the rubber and shoelaces, but before paying for things like store rent or TV commercials.
+55.9%
+1.2%
+2.2%
Operating MarginThe 'day job' efficiency score. Out of every dollar a customer spends, this shows how many cents the company keeps after making the product AND paying for all the everyday corporate overhead (like salaries, marketing, and keeping the lights on).
+26.4%
+1.8%
+6.7%
Net MarginThe final take-home percentage. When you strip away every conceivable cost, tax, and interest payment, this is the exact number of cents the company truly gets to keep from every dollar in sales.
+11.5%
+17.7%
+101.4%
Free Cash FlowThe holy grail of corporate cash. It's the spendable, physical money left over after the business pays for its daily operations AND buys the big, expensive upgrades (like new factories or servers) it needs to survive. This is the 'free' money they can use to pay dividends or buy back stock.
$11.3B
+0.8%
-61.2%
FCF MarginThe ultimate cash conversion rate. It shows how good the company is at turning regular sales directly into cold, hard, spendable cash. A high percentage means the business is an absolute cash-printing machine.
+19.0%
+1.6%
-62.8%
Debt / EquityThe financial risk gauge. It compares how much of the company's empire was built using borrowed money (loans) versus the owners' own money (shareholders). A high number means they are heavily leveraged and playing a riskier game; a low number means they are playing it safe.
83.7%
-9.3%
-7.6%
Current RatioThe 12-month survival check. It simply compares the cash they have right now (plus things they can quickly turn into cash) against the immediate bills they absolutely must pay this year. A score above 1 means they have enough in the wallet to cover the upcoming bills without panicking.
0.72x
+3.3%
-7.5%
Total AssetsThe absolute size of the company's empire. It bundles together absolutely everything of value they own—from the cash in the register and the inventory in the warehouse, to the software patents in the vault and the factories on the ground.
Operator: Welcome to AB InBev's Full Year 2025 Earnings Conference Call and Webcast. Hosting the call today from AB InBev are Mr. Michel Doukeris, Chief Executive Officer; and Mr. Fernando Tennenbaum, Chief Financial Officer. [Operator Instructions] Today's webcast will be available for on-demand playback later today. [Operator Instructions] Some of the information provided during the conference call may contain statements of future expectations and other forward-looking statements. These expectations are based on management's current views and assumptions and involve known and unknown risks and uncertainties. It is possible that AB InBev's actual results and financial condition may differ, possibly materially from the anticipated results and financial condition indicated in these forward-looking statements. For a discussion of some of the risks and important factors that could affect AB InBev's future results, see risk factors in the company's latest annual report on Form 20-F filed with the Securities and Exchange Commission on March 12, 2025. AB InBev assumes no obligation to update or revise any forward-looking information provided during the conference call and shall not be liable for any action taken in reliance upon such information. It is now my pleasure to turn the floor over to Mr. Michel Doukeris. Sir, you may begin.
Michel Doukeris: Thank you, and welcome, everyone, to our full year 2025 earnings call. It is a great pleasure to be speaking with you all today. Today, Fernando and I will take you through our operating highlights and provide you with an update on the progress we have made in executing our strategic priorities. After that, we'll be happy to answer your questions. Let's start with the key highlights for the year. In 2025, we executed our strategy with discipline, delivering another year of dollar-based EPS growth, continued margin expansion and solid free cash flow generation, even as we navigated a dynamic consumer environment. As we reflect on the year, we are encouraged with the consistency of our financial performance, the durability of our strategy and the resilience of our business. While near-term demand across many CPG categories was impacted by a constrained consumer environment and unseasonal weather, we continue to invest in our strategic priorities. We remain disciplined in our revenue management choices and delivered EBITDA growth within our outlook. We continue to make progress this year. We strengthened our operating model and increased our portfolio brand power. We also formed new long-term partnerships to extend the reach of our brands and deepen the connection to our consumers. The momentum of our growth priorities continued. Our mega brands and premium portfolio grew ahead of our overall business. The growth of our Beyond Beer and non-alcohol beer portfolios accelerated, increasing revenue by 23% and 34%, respectively. And BEES Marketplace GMV increased by 61% to now reach $3.5 billion. Solid free cash …