
Seeking Alpha7/30/2026Neutral
Ambev S.A. (ABEV) Q2 2026 Earnings Call Transcript
Ambev S.A. (ABEV) Q2 2026 Earnings Call Transcript

Ambev S.A., operating through its various subsidiaries, is a prominent player in the beverage and food industry across the Americas. The company ...
Plutux is not an investment adviser. Market data and AI-generated analysis are for information and education only, not investment advice. Disclaimer
$0.73 per share
Est. EPS $0.25 · Revenue $22.01B · 2 analysts
Est. EPS $0.32 · Revenue $26.05B · 2 analysts
Est. EPS $1.05 · Revenue $91.45B · 5 analysts
EPS BRL 0.22 · Revenue BRL 20.15B
EPS BRL 0.24 · Revenue BRL 22.46B
EPS BRL 0.99 · Revenue BRL 88.24B
EPS BRL 0.30 · Revenue BRL 20.85B
EPS BRL 0.17 · Revenue BRL 20.09B
EPS BRL 0.23 · Revenue BRL 22.50B
| Metric | Latest | YoYYoY means Year-over-Year. It compares the latest annual value with the previous annual value to show long-term trend strength. | QoQQoQ means Quarter-over-Quarter. It compares the latest quarter with the immediately previous quarter to show short-term momentum changes. |
|---|---|---|---|
| RevenueThe total money that came through the front door from selling things, before paying a single bill. Think of it as the grand total of every credit card swipe from customers. (YoY compares this year to last year's performance, while QoQ compares the current three months to the previous three). | $88.2B | -1.4% | -10.3% |
| Net IncomeThe absolute bottom line. If the company paid every single supplier, employee, banker, and tax collector, this is the actual money left in their pocket at the end of the day. | $15.5B | +7.4% | -10.1% |
| Gross MarginThe basic markup. If they sell a $100 pair of sneakers, this percentage tells you how much of that price tag is profit right after paying for the rubber and shoelaces, but before paying for things like store rent or TV commercials. | +51.4% | +0.4% | +0.6% |
| Operating MarginThe 'day job' efficiency score. Out of every dollar a customer spends, this shows how many cents the company keeps after making the product AND paying for all the everyday corporate overhead (like salaries, marketing, and keeping the lights on). | +25.3% | +3.8% | -9.6% |
| Net MarginThe final take-home percentage. When you strip away every conceivable cost, tax, and interest payment, this is the exact number of cents the company truly gets to keep from every dollar in sales. | +17.6% | +8.9% | +0.2% |
| Free Cash FlowThe holy grail of corporate cash. It's the spendable, physical money left over after the business pays for its daily operations AND buys the big, expensive upgrades (like new factories or servers) it needs to survive. This is the 'free' money they can use to pay dividends or buy back stock. | $19.9B | -7.0% | +42.2% |
| FCF MarginThe ultimate cash conversion rate. It shows how good the company is at turning regular sales directly into cold, hard, spendable cash. A high percentage means the business is an absolute cash-printing machine. | +22.5% | -5.7% | +58.6% |
| Debt / EquityThe financial risk gauge. It compares how much of the company's empire was built using borrowed money (loans) versus the owners' own money (shareholders). A high number means they are heavily leveraged and playing a riskier game; a low number means they are playing it safe. | 6.1% | +73.8% | -3.1% |
| Current RatioThe 12-month survival check. It simply compares the cash they have right now (plus things they can quickly turn into cash) against the immediate bills they absolutely must pay this year. A score above 1 means they have enough in the wallet to cover the upcoming bills without panicking. | 0.96x | -12.2% | -0.6% |
| Total AssetsThe absolute size of the company's empire. It bundles together absolutely everything of value they own—from the cash in the register and the inventory in the warehouse, to the software patents in the vault and the factories on the ground. | $148.1B | -8.9% | -3.2% |
| Metric | Annual (A vs E) | Annual Surprise | Quarter (A vs E) | Quarter Surprise |
|---|---|---|---|---|
| EPS Surprise | 0.99 vs 1.00 | -0.7% | 0.22 vs 0.19 | +14.9% |
| Revenue Surprise | $88.2B vs $90.5B | -2.5% | $20.1B vs $20.9B | -3.8% |
| Date | Executive | Title | Security | Side | Shares | Price |
|---|---|---|---|---|---|---|
| Jul 30, 2026 | Moreira Ricardo Manuel Frangatos Pires | director | Common Shares | D | 468,040 | $3.08 |
| May 5, 2026 | Zagman Paulo Andre | officer: See Remarks | Common Shares | D | 136,250 | $3.41 |
| May 4, 2026 | Derbli de Carvalho Joao Coelho Rua | officer: See Remarks | Common Shares | — | 0 | — |
| May 4, 2026 | Derbli de Carvalho Joao Coelho Rua | officer: See Remarks | Restricted Shares | — | 38,843 | — |
| Mar 30, 2026 | Klutzenschell Lisboa Carlos Eduardo | officer: Chief Executive Officer | Common Shares | A | 205,372 | $3.11 |
Operator: Good afternoon, and thank you for waiting. We would like to welcome everyone to Ambev's 2026 Second Quarter Conference Call. Today with us, we have Mr. Carlos Lisboa, Ambev's CEO; and Mr. Guilherme Fleury, CFO and Investor Relations Officer. As a reminder, this conference presentation is available for download on our website, ri.ambev.com.br as well as through the webcast link. We would like to inform you that this event is being recorded. Before proceeding, let me mention that forward-looking statements are being made under the safe harbor of the Securities Litigation Reform Act of 1996. Forward-looking statements are based on the beliefs and assumptions of Ambev's management and on information currently available to the company. They involve risks, uncertainties and assumptions because they relate to the future events and therefore, depend on circumstances that may or may not occur in the future. Investors should understand that general economic conditions, industry conditions and other operating factors could also affect the future results of Ambev and could cause results to differ materially from those expressed in such forward-looking statements. I would also like to remind everyone that, as usual, the percentage changes that will be discussed during today's call are both organic and normalized in nature and unless otherwise stated, percentage changes refer to comparison with 2025 second quarter results. Normalized figures refer to performance measures before exceptional items, which are either income or expenses that do not occur regularly as part of Ambev's normal activities. As normalized figures are non-GAAP measures, the company disclosed the consolidated profit, EPS, operating profit and EBITDA on a fully reported basis in the earnings release. Now I will turn the conference over to Mr. Carlos Lisboa. Mr. Lisboa, you may begin your conference. Carlos Eduardo Lisboa: Good afternoon, everyone, and thank you for joining our second quarter earnings call. Across our footprint, football is part of our culture, one of the strongest passion points that bring people together, and beer has a unique role in creating such special moments. I want to congratulate all the national teams from our markets that represented their countries in the FIFA World Cup. I also want to recognize our teams for their outstanding execution across Ambev's footprint. Moments like these are also where our company stands out. The World Cup is one of the toughest execution tests in our industry. The challenge goes beyond activating a campaign. It is about turning a tournament into a semester-long platform, activating a portfolio rather than a single brand and connecting consumers and customers across countries, channels and millions of points of sale while building engagement that lasts beyond the final whistle. Across our markets, our brands were among those most associated with the event. We did not just take part of the World Cup. We helped shape the …
| Name | Title | Gender | Year Born | Status |
|---|---|---|---|---|
Guilherme Yokaichiya | Investor Relations Officer | — | — | Active |
Stella Pescaroli Lopes | Draftline Media & Data Director | — | — | Active |
Carlos Eduardo Klutzenschell Lisboa | Chief Executive Officer & Member of Board of Executive Officers | Male | 1969 | Active |
Valdecir Duarte | Vice President of Supplies & Member of Executive Board | Male | 1981 | Active |
Guilherme Fleury de Figueiredo Ferraz Parolari | CFO, Investor Relations Officer & Member of the Executive Board | Male | — | Active |
Guilherme Malik Parente | Legal & Compliance Vice President Officer, Secretary & Member of Executive Board Officers | Male | — | Active |
Joao Coelho Rua Derbli de Carvalho | Commercial VP Officer & Member of Executive Board | Male | 1983 | Active |
Paulo André Zagman | Vice President Officer of Logistics & Member of Executive Board of Officers | Male | 1977 | Active |
Carla Smith de Vasconcellos Crippa Prado | VP of Corporate Affairs & Member of Executive Board of Officers | Female | 1982 | Active |
Paula Guz | Director of Marketing Transformation | — | — | Active |
Ambev S.A. (ABEV) Q2 2026 Earnings Call Transcript
Ambev NYSE: ABEV reported stronger second-quarter operating performance, led by beer-volume growth, revenue management and margin expansion, while continuing to invest in brand activations tied to the FIFA World Cup.
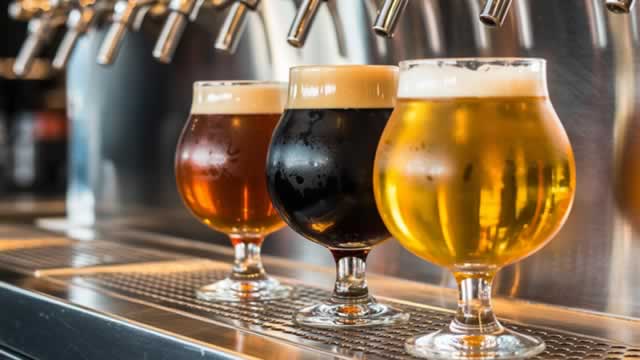
Investors interested in stocks from the Beverages - Alcohol sector have probably already heard of Cervecerias Unidas (CCU) and Ambev (ABEV). But which of these two stocks offers value investors a better bang for their buck right now?

Ambev (ABEV) has been upgraded to a Zacks Rank #2 (Buy), reflecting growing optimism about the company's earnings prospects. This might drive the stock higher in the near term.
Here is how Ambev (ABEV) and Chefs' Warehouse (CHEF) have performed compared to their sector so far this year.