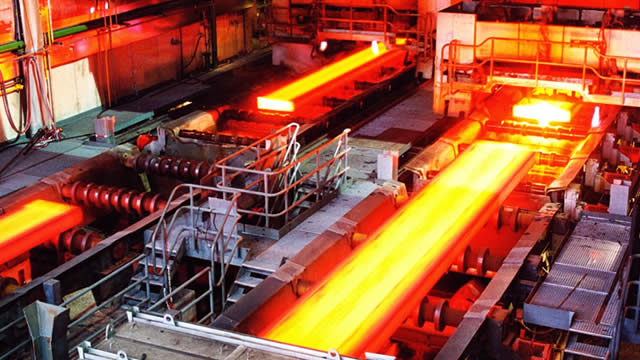
ArcelorMittal S.A. and its subsidiaries operate as a comprehensive, globally integrated steel production and mining enterprise, with operations spanning Europe, North and ...
ArcelorMittal S.A. (NYSE: MT) is a globally integrated steel and mining business that operates along the supply chain from raw materials to finished steel. The company describes itself as building “smarter steels for people and planet,” reflecting both the scale of its industrial footprint and its focus on innovation in ...ArcelorMittal S.A. (NYSE: MT) is a globally integrated steel and mining business that operates along the supply chain from raw materials to finished steel. The company describes itself as building “smarter steels for people and planet,” reflecting both the scale of its industrial footprint and its focus on innovation in steelmaking and downstream applications. Its core activities include mining and processing iron ore and coal, converting those inputs into crude steel, and producing a wide range of finished and semi-finished steel products.
On the products side, ArcelorMittal manufactures flat steel products such as slabs and finished sheets and coils, including hot-rolled and cold-rolled coils and sheets, galvanized products (hot-dipped and electro-galvanized), tinplate, and pre-painted coils and sheets. For long products, it produces items such as blooms and billets as semi-finished forms, and then finished long steel including bars, wire-rods, structural sections, railway rails, sheet piles, and various wire products. In addition to steel, it also produces certain pipe and tube offerings (including seamless and welded types), extending its materials reach into industrial and infrastructure-related markets.
From a business model and operations perspective, the integration of mining and steel production is a key differentiator. The company extracts and processes iron ore in multiple regions (e.g., Brazil, Bosnia, Canada, Kazakhstan, Liberia, Mexico, South Africa, and Ukraine), while coal mining is concentrated in Kazakhstan. That integration matters economically because steel production is highly input- and energy-intensive: the “costs and BOM” of steelmaking are dominated by iron ore, coal/coke (or other coal-related inputs depending on process route), scrap/recycling inputs (where used), energy, and freight/logistics across a network spanning many countries. Effective procurement, logistics optimization, and plant utilization are therefore central to competitiveness.
Financially and at scale, the provided figures indicate very large operations and market reach. ArcelorMittal reported revenue of about US$61.352 billion (2025) in the provided leadership context, and its operational footprint includes very high annual production/shipments (e.g., crude steel and steel shipments) and significant research activity (14 research centres and 1,650 full-time researchers noted). Such scale typically supports the amortization of capital-intensive assets like blast furnaces, rolling mills and related facilities, while also enabling product development for specialized applications.
Key people include CEO Aditya Mittal, alongside Executive Chairperson Lakshmi N. Mittal, reflecting leadership continuity from the group’s earlier origins and acquisitions. The company’s long-term strategic emphasis is generally aligned with maintaining global competitiveness through innovation, operational excellence, and decarbonization pathways for steelmaking, while serving end markets such as automotive, construction, energy, engineering, domestic appliances, and heavy machinery—industries that depend on reliable supply of engineered steel.
Overall, ArcelorMittal’s profile is that of an end-to-end steel and mining operator: it converts mined raw materials into a diversified portfolio of steel products for customers worldwide, with costs and performance driven by input economics (iron ore and coal), energy intensity, plant efficiency, and global logistics.
YoYYoY means Year-over-Year. It compares the latest annual value with the previous annual value to show long-term trend strength.
QoQQoQ means Quarter-over-Quarter. It compares the latest quarter with the immediately previous quarter to show short-term momentum changes.
RevenueThe total money that came through the front door from selling things, before paying a single bill. Think of it as the grand total of every credit card swipe from customers. (YoY compares this year to last year's performance, while QoQ compares the current three months to the previous three).
$61.4B
-1.7%
+8.4%
Net IncomeThe absolute bottom line. If the company paid every single supplier, employee, banker, and tax collector, this is the actual money left in their pocket at the end of the day.
$3.2B
+135.4%
+18.8%
Gross MarginThe basic markup. If they sell a $100 pair of sneakers, this percentage tells you how much of that price tag is profit right after paying for the rubber and shoelaces, but before paying for things like store rent or TV commercials.
+9.6%
+3.8%
-35.2%
Operating MarginThe 'day job' efficiency score. Out of every dollar a customer spends, this shows how many cents the company keeps after making the product AND paying for all the everyday corporate overhead (like salaries, marketing, and keeping the lights on).
+5.9%
+11.6%
+29.2%
Net MarginThe final take-home percentage. When you strip away every conceivable cost, tax, and interest payment, this is the exact number of cents the company truly gets to keep from every dollar in sales.
+5.1%
+139.6%
+9.5%
Free Cash FlowThe holy grail of corporate cash. It's the spendable, physical money left over after the business pays for its daily operations AND buys the big, expensive upgrades (like new factories or servers) it needs to survive. This is the 'free' money they can use to pay dividends or buy back stock.
$471.0M
+5.4%
-11.1%
FCF MarginThe ultimate cash conversion rate. It shows how good the company is at turning regular sales directly into cold, hard, spendable cash. A high percentage means the business is an absolute cash-printing machine.
+0.8%
+7.2%
-2.5%
Debt / EquityThe financial risk gauge. It compares how much of the company's empire was built using borrowed money (loans) versus the owners' own money (shareholders). A high number means they are heavily leveraged and playing a riskier game; a low number means they are playing it safe.
24.6%
+4.8%
+6.1%
Current RatioThe 12-month survival check. It simply compares the cash they have right now (plus things they can quickly turn into cash) against the immediate bills they absolutely must pay this year. A score above 1 means they have enough in the wallet to cover the upcoming bills without panicking.
1.36x
+0.9%
+3.1%
Total AssetsThe absolute size of the company's empire. It bundles together absolutely everything of value they own—from the cash in the register and the inventory in the warehouse, to the software patents in the vault and the factories on the ground.
Daniel Fairclough: Good afternoon, everyone. This is Daniel Fairclough from the ArcelorMittal Investor Relations team. Thank you for joining this call today to discuss our performance and progress in the second quarter and first half of 2026. Leading today's call will be our Group CFO, Mr. Genuino Christino. Before we begin, I would like to mention a few housekeeping items. As usual, we will not be going through the results presentation, which was published this morning on our website. However, I do want to draw your attention to the disclaimers on slide 21 of that presentation. Following opening remarks from Genuino, we will be moving directly to the Q&A session. If you'd like to ask a question, please do press star one one on your keypad to join the queue. With that, I'll hand over the call to Genuino.
Genuino Christino: Thanks, Daniel. Welcome everyone, and thanks for joining today's call. As usual, I will keep my remarks brief. Let me start with safety, which remains our highest priority. ArcelorMittal Safety Transformation continues to deliver measurable progress. The frequency rate of lost time injuries in the first six months of the year was a record low for our company. While we are encouraged by these improvements, we remain firmly focused on driving further progress. Turning now to the business, I would like to focus on three key points. First, we are seeing positive near-term momentum across the business. The operating environment has improved through the first half of the year, driving improved results, and with positive momentum across all segments. There is more improvement to come. EBITDA for the second quarter improved to $2.1 billion. This represents a margin of $155 per ton, which is well above our previous through-the-cycle averages. Our European segment delivered an EBITDA per ton of $98, which is a three-years high, and demonstrates the early signs of the improved policy backdrop. Importantly, these results do not yet reflect the benefits of the new TRQ trade tool, which are becoming increasingly evident. Customer engagement is higher, our order book is getting stronger, and prices are bucking the normal seasonal trends. Reflecting these positive dynamics, we have announced production restarts in Spain, Poland and more recently France. As we head into August, we have our full suite of blast furnaces in operation. As a result, we are guiding to third quarter shipments to be stable to higher than the second quarter, which would represent a powerful counterseasonal outcome. Underlying free cash flow in the first half was strong, annualizing at $2.5 billion, excluding seasonal working capital investments and the strategic growth CapEx. This is a strong outcome at this stage of the cycle and provides the foundation for continued investments and returns of capital to shareholders. This brings me to my second point, our differentiated portfolio of strategic growth projects and the opportunities that we are developing into growth …