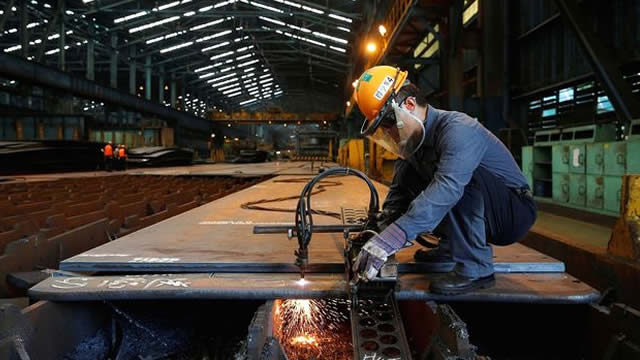
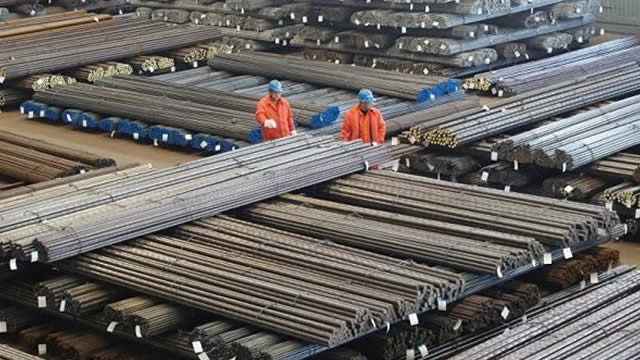
POSCO Holdings Inc. (NYSE: PKX) is the holding-company structure of the POSCO Group, centered on the creation and distribution of steel-based value chains and expanded into infrastructure, resources, and technology-oriented businesses. Founded April 1, 1968 and headquartered in Pohang, South Korea, the group’s historical core is integrated steelmaking—providing the foundational ...POSCO Holdings Inc. (NYSE: PKX) is the holding-company structure of the POSCO Group, centered on the creation and distribution of steel-based value chains and expanded into infrastructure, resources, and technology-oriented businesses. Founded April 1, 1968 and headquartered in Pohang, South Korea, the group’s historical core is integrated steelmaking—providing the foundational inputs that support manufacturing, construction, transportation, and industrial development across multiple regions.
Business model and segments: POSCO Holdings’ operating structure is commonly described through four main segments: (1) Steel—covering hot-rolled and cold-rolled products, steel plates, wire rods, galvanized sheets, electrical steel, stainless steel, and titanium; (2) Construction—design, fabrication, and erection of steel mills and infrastructure facilities, as well as commercial and residential construction-related services; (3) Trading—import/export of raw materials and procurement and distribution of steel and steel-related products; and (4) Others—an expansive category that may include infrastructure and industrial services such as logistics and cargo handling, power generation and system integration, and additional resource-management activities. The “Others” umbrella can also include engineering and consulting, resource and mine development, materials and industrial services (e.g., refractory materials or related manufacturing activities), real estate development and management, venture/technology investments, IT and engineering services, and broader social or community initiatives.
Products and services: From a product perspective, the group’s scale in steel manufacturing allows it to serve both commodity-like demand (e.g., plate and sheet products) and more specialized applications (e.g., electrical steel for energy and industrial equipment). The diversification into construction and engineering services enables POSCO to deliver not only materials but also parts of the built-environment and industrial-asset lifecycle.
Economics, cost considerations, and financial profile (high level): Steel and materials businesses are typically sensitive to input costs (iron ore, coal and energy), freight/logistics, FX, utilization rates, and demand cycles. The provided snapshot indicates relatively modest operating profitability margins (e.g., gross margin around 8% and operating/EBIT margins around the low-3% range), which is consistent with a capital-intensive, competitive industry where cost discipline and scale matter. Cash-flow performance can be volatile due to working-capital swings and investment cycles; the dataset shows negative free cash flow measures in the snapshot, while leverage and coverage indicators suggest the need for ongoing operational efficiency and financing management. The presence of a large trading/industrial-services footprint can partially smooth demand but also introduces inventory and receivables management considerations.
Key people and governance: The company’s CEO is In-Hwa Chang (serving as CEO & Representative Director per the provided information). As a group holding company, leadership and governance focus on strengthening core competencies, accelerating growth businesses, and expanding into future-oriented areas.
Employees and scale: With tens of thousands of employees globally (the supplied full-time count is 42,873), POSCO Holdings is a large employer operating across multiple lines of business that require industrial, engineering, logistics, and technology capabilities.
“Wishes”/forward direction (typical strategic intent): Based on POSCO Group positioning as a sustainable materials and long-horizon industrial company, the group’s ongoing intent is generally aligned with decarbonization, more efficient energy use, and scaling eco-friendly materials and future technologies—while maintaining core steel competitiveness and expanding higher-value applications.
YoYYoY means Year-over-Year. It compares the latest annual value with the previous annual value to show long-term trend strength.
QoQQoQ means Quarter-over-Quarter. It compares the latest quarter with the immediately previous quarter to show short-term momentum changes.
RevenueThe total money that came through the front door from selling things, before paying a single bill. Think of it as the grand total of every credit card swipe from customers. (YoY compares this year to last year's performance, while QoQ compares the current three months to the previous three).
$68986.9B
-5.1%
+7.7%
Net IncomeThe absolute bottom line. If the company paid every single supplier, employee, banker, and tax collector, this is the actual money left in their pocket at the end of the day.
$690.7B
-36.9%
+32.1%
Gross MarginThe basic markup. If they sell a $100 pair of sneakers, this percentage tells you how much of that price tag is profit right after paying for the rubber and shoelaces, but before paying for things like store rent or TV commercials.
+7.4%
+0.5%
+1.5%
Operating MarginThe 'day job' efficiency score. Out of every dollar a customer spends, this shows how many cents the company keeps after making the product AND paying for all the everyday corporate overhead (like salaries, marketing, and keeping the lights on).
+2.7%
-21.5%
-4.8%
Net MarginThe final take-home percentage. When you strip away every conceivable cost, tax, and interest payment, this is the exact number of cents the company truly gets to keep from every dollar in sales.
+1.0%
-33.5%
+22.6%
Free Cash FlowThe holy grail of corporate cash. It's the spendable, physical money left over after the business pays for its daily operations AND buys the big, expensive upgrades (like new factories or servers) it needs to survive. This is the 'free' money they can use to pay dividends or buy back stock.
$-1669.3B
-11.4%
+93.7%
FCF MarginThe ultimate cash conversion rate. It shows how good the company is at turning regular sales directly into cold, hard, spendable cash. A high percentage means the business is an absolute cash-printing machine.
-2.4%
-17.3%
+94.2%
Debt / EquityThe financial risk gauge. It compares how much of the company's empire was built using borrowed money (loans) versus the owners' own money (shareholders). A high number means they are heavily leveraged and playing a riskier game; a low number means they are playing it safe.
51.2%
+10.8%
+3.9%
Current RatioThe 12-month survival check. It simply compares the cash they have right now (plus things they can quickly turn into cash) against the immediate bills they absolutely must pay this year. A score above 1 means they have enough in the wallet to cover the upcoming bills without panicking.
1.89x
-2.5%
+4.4%
Total AssetsThe absolute size of the company's empire. It bundles together absolutely everything of value they own—from the cash in the register and the inventory in the warehouse, to the software patents in the vault and the factories on the ground.
Operator: Greetings, everyone. Thank you for coming to attend the conference call for POSCO Holdings earnings release. Today, we will have a presentation from POSCO Holdings first, and then we will have a Q&A with all of you. [Operator Instructions] So now I'd like to begin the POSCO Holdings 2026 Second Quarter Earnings Release.
Seung-Jun Kim: Greetings, everyone. I'm Head of Finance and IR Division at POSCO Holdings. My name is Kim Seung-Jun. Despite the harsh heat, thank you for attending the second quarter earnings for POSCO Holdings. My sincere thanks go to the investors and the analysts. In the second quarter, the Middle East conflict triggered energy supply risk intensified, while the Korean won continued to lose value, business faced headwinds. Nevertheless, POSCO Holdings recorded consolidated revenue of KRW 19.3 trillion and KRW 820 billion in OP, keeping the rising profit curve. Gains were recorded against previous quarter in all key sectors of steel, rechargeable battery materials and energy. Most notable is our Argentina lithium business that turned a first-ever quarterly profit. So the general RBM sector transitioned to a surplus for the first time in 9 quarters. Our steelmaking affiliate, POSCO registered its separate OP of KRW 270 billion, a KRW 60 billion gain over the previous quarter. On third quarter outlook, what is most notable is that POSCO will make more visible performance gains. While some raw material costs will climb, increased production will offset fixed costs. Through effort made to increase sales and sales price, we expect the rise to continue. In the rechargeable battery materials sector, following its first ever quarterly surplus in the second quarter, a temporary slowdown may be observed in the third quarter. Located in the Southern Hemisphere, it is winter in Argentina. This seasonal factor causes pond evaporation to dwindle. By leveraging this off-season, we plan to replace the LP dryer equipment. Hence, a temporary drop in production volume seems inevitable. Starting in the fourth quarter, however, the plant will run at full operation. Additionally, in Q4, long-term supply agreement will kick in, allowing us to deliver certified products. Therefore, we anticipate a more meaningful level up in Q4. Besides the performance gains, the first half of this year demonstrated marked progress in building for future growth. One is Gwangyang's first EAF operation and the other the HyREX demo plant construction start. POSCO Holdings is committed to upholding the 2 pillars of growth, which are profit enhancement by sector and strategic investment for future growth. We'll do our best to continue to grow our corporate value. Now I will give the floor to our IR Office Head to offer more second quarter details.
Young-Ah Han: Next, we will move on to Page 3 of the materials, and I will brief you on the business performance of the second quarter 2026. The consolidated revenue of the second quarter was KRW 19.3 trillion, which …