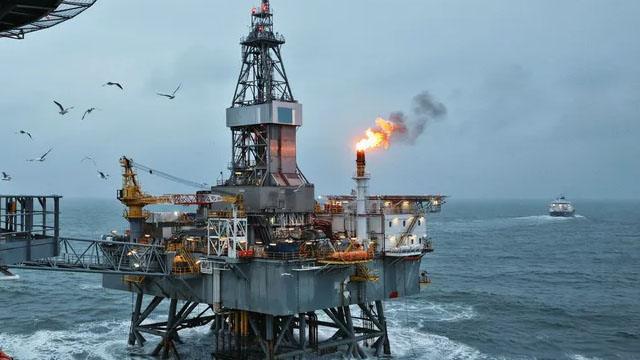
Magnolia Oil & Gas Corporation is an energy company engaged in the full lifecycle of hydrocarbon resource management: acquisition, development, exploration, and ...
Magnolia Oil & Gas Corporation (MGY) is an independent energy company engaged in the full lifecycle of hydrocarbon resource management, including acquisition, development, exploration, and production. Headquartered in Houston, Texas, the company was incorporated in 2017 and operates primarily in Karnes County and the Giddings Field in South Texas, targeting ...Magnolia Oil & Gas Corporation (MGY) is an independent energy company engaged in the full lifecycle of hydrocarbon resource management, including acquisition, development, exploration, and production. Headquartered in Houston, Texas, the company was incorporated in 2017 and operates primarily in Karnes County and the Giddings Field in South Texas, targeting the rich Eagle Ford Shale and Austin Chalk formations. As of December 31, 2021, Magnolia held a substantial leasehold of 471,263 net acres, comprising 23,785 net acres in Karnes and 447,478 net acres in Giddings, with 1,292 net wells producing approximately 66,000 barrels of oil equivalent per day. The company emphasizes shareholder returns through a premier asset platform, substantial free cash flow generation, and disciplined capital allocation. As of the latest TTM data, Magnolia has a market capitalization of $4.64 billion, revenue per share of $8.02, and a price-to-earnings ratio of 10.9. Financially, it boasts a strong profitability profile with a net profit margin of 28.8%, an EBITDA margin of 69%, and a return on equity of 21.1%. The company maintains a conservative balance sheet with a debt-to-equity ratio of 18.3% and a net debt to EBITDA of 0.096. Magnolia pays a dividend of $0.63 per share, yielding 2.5%, with a payout ratio of 27.5%. The company employs 262 full-time staff and operates under the leadership of President and CEO Christopher G. Stavros, who has served since September 2022. With a strategic focus on low-cost, high-margin production, Magnolia continues to generate strong operating cash flows, evidenced by an operating cash flow per share of $5.61 and a free cash flow yield of 11.3%. The company's efficient capital expenditures, low leverage, and consistent free cash flow underscore its commitment to value creation for shareholders.
YoYYoY means Year-over-Year. It compares the latest annual value with the previous annual value to show long-term trend strength.
QoQQoQ means Quarter-over-Quarter. It compares the latest quarter with the immediately previous quarter to show short-term momentum changes.
RevenueThe total money that came through the front door from selling things, before paying a single bill. Think of it as the grand total of every credit card swipe from customers. (YoY compares this year to last year's performance, while QoQ compares the current three months to the previous three).
$1.3B
-0.3%
+33.6%
Net IncomeThe absolute bottom line. If the company paid every single supplier, employee, banker, and tax collector, this is the actual money left in their pocket at the end of the day.
$325.3M
-11.1%
+82.1%
Gross MarginThe basic markup. If they sell a $100 pair of sneakers, this percentage tells you how much of that price tag is profit right after paying for the rubber and shoelaces, but before paying for things like store rent or TV commercials.
+46.7%
-9.7%
+66.5%
Operating MarginThe 'day job' efficiency score. Out of every dollar a customer spends, this shows how many cents the company keeps after making the product AND paying for all the everyday corporate overhead (like salaries, marketing, and keeping the lights on).
+33.5%
-14.0%
+40.4%
Net MarginThe final take-home percentage. When you strip away every conceivable cost, tax, and interest payment, this is the exact number of cents the company truly gets to keep from every dollar in sales.
+24.8%
-10.9%
+36.3%
Free Cash FlowThe holy grail of corporate cash. It's the spendable, physical money left over after the business pays for its daily operations AND buys the big, expensive upgrades (like new factories or servers) it needs to survive. This is the 'free' money they can use to pay dividends or buy back stock.
$409.2M
-5.7%
+279.7%
FCF MarginThe ultimate cash conversion rate. It shows how good the company is at turning regular sales directly into cold, hard, spendable cash. A high percentage means the business is an absolute cash-printing machine.
+31.2%
-5.5%
+184.3%
Debt / EquityThe financial risk gauge. It compares how much of the company's empire was built using borrowed money (loans) versus the owners' own money (shareholders). A high number means they are heavily leveraged and playing a riskier game; a low number means they are playing it safe.
21.6%
+0.9%
-9.6%
Current RatioThe 12-month survival check. It simply compares the cash they have right now (plus things they can quickly turn into cash) against the immediate bills they absolutely must pay this year. A score above 1 means they have enough in the wallet to cover the upcoming bills without panicking.
1.54x
+8.5%
-12.8%
Total AssetsThe absolute size of the company's empire. It bundles together absolutely everything of value they own—from the cash in the register and the inventory in the warehouse, to the software patents in the vault and the factories on the ground.
Operator: Good morning, everyone, and thank you for participating in Magnolia Oil and Gas Corporation's Second Quarter 26 Earnings Conference Call. My name is Megan, and I will be your moderator for today's call. At this time, all participants will be placed in a listen-only mode as our call is being recorded. I will now turn the call over to Magnolia's management for their prepared remarks, which will be followed by a brief question-and-answer session.
Tom Fitter: Thank you, Megan, and good morning, everyone. Welcome to Magnolia Oil and Gas' second quarter earnings conference call. Participating on the call today are Christopher G. Stavros, Magnolia's Chairman, President and Chief Executive Officer and Brian Michael Corales, Senior Vice President and Chief Financial Officer. As a reminder, today's conference call contains certain projections and other forward-looking statements, which are within the meaning of the federal securities laws. These statements are subject to risks and uncertainties that may cause actual results to differ materially from those expressed or implied in these statements. Additional information on risk factors that could cause results to differ available in the company's annual report on Form 10-Ks filed with the SEC. A full Safe Harbor can be found on Slide 2 of the conference call slide presentation with the supplemental data on our website. You can download Magnolia's second quarter 26 earnings press release as well as the conference call slides from the Investors section of the company's website, www.magnoliaoilgas.com. I will now turn the call over to Mr. Christopher G. Stavros.
Christopher G. Stavros: Tom, and good morning, everyone. Thank you all for joining us today for a discussion of our second quarter 26 financial and operating results. I know that today is a very busy day of earnings. I will briefly cover our second quarter results which continue to validate the consistent high quality nature of our Giddings asset and provide strong overall financial results, returns, together with our current rate business. I will then highlight a few items related to the financing underlying our recent agreement to acquire Wildfire Energy. Brian will then review our financial results for the second quarter in greater detail and provide some additional guidance before we take your questions. Beginning on Slide 3 in our quarterly investor presentation, Magnolia marked its 8 year anniversary by delivering another quarter of strong and consistent execution as seen through our financial and operating metrics which continue to underscore the strength of our differentiated business model and the quality of our asset base. Strong second quarter financial metrics were supported by both solid production growth and higher year over year oil and NGL prices. Our second quarter adjusted net income was approximately $184 million or $0.99 per diluted share with adjusted EBITDAX of $370 million during the period. Drilling and completion …