
Zacks Investment Research8/5/2026Neutral
Why Gap (GAP) is a Top Momentum Stock for the Long-Term
Wondering how to pick strong, market-beating stocks for your investment portfolio? Look no further than the Zacks Style Scores.

The Gap, Inc. operates as a prominent apparel retail enterprise, offering a diverse array of clothing, accessories, and personal care products for ...
Plutux is not an investment adviser. Market data and AI-generated analysis are for information and education only, not investment advice. Disclaimer
$0.68 per share
$0.68 per share
Est. EPS $0.79 · Revenue $4.01B · 5 analysts
Est. EPS $2.42 · Revenue $15.54B · 6 analysts
| Metric | Latest | YoYYoY means Year-over-Year. It compares the latest annual value with the previous annual value to show long-term trend strength. | QoQQoQ means Quarter-over-Quarter. It compares the latest quarter with the immediately previous quarter to show short-term momentum changes. |
|---|---|---|---|
| RevenueThe total money that came through the front door from selling things, before paying a single bill. Think of it as the grand total of every credit card swipe from customers. (YoY compares this year to last year's performance, while QoQ compares the current three months to the previous three). | $15.4B | +1.9% | +4.4% |
| Net IncomeThe absolute bottom line. If the company paid every single supplier, employee, banker, and tax collector, this is the actual money left in their pocket at the end of the day. | $816.0M | -3.3% | +47.8% |
| Gross MarginThe basic markup. If they sell a $100 pair of sneakers, this percentage tells you how much of that price tag is profit right after paying for the rubber and shoelaces, but before paying for things like store rent or TV commercials. | +40.8% | -1.2% | +30.4% |
| Operating MarginThe 'day job' efficiency score. Out of every dollar a customer spends, this shows how many cents the company keeps after making the product AND paying for all the everyday corporate overhead (like salaries, marketing, and keeping the lights on). | +7.3% | -1.6% | +45.5% |
| Net MarginThe final take-home percentage. When you strip away every conceivable cost, tax, and interest payment, this is the exact number of cents the company truly gets to keep from every dollar in sales. | +5.3% | -5.1% | +41.6% |
| Free Cash FlowThe holy grail of corporate cash. It's the spendable, physical money left over after the business pays for its daily operations AND buys the big, expensive upgrades (like new factories or servers) it needs to survive. This is the 'free' money they can use to pay dividends or buy back stock. | $823.0M | -20.8% | +134.6% |
| FCF MarginThe ultimate cash conversion rate. It shows how good the company is at turning regular sales directly into cold, hard, spendable cash. A high percentage means the business is an absolute cash-printing machine. | +5.4% | -22.2% | +124.7% |
| Debt / EquityThe financial risk gauge. It compares how much of the company's empire was built using borrowed money (loans) versus the owners' own money (shareholders). A high number means they are heavily leveraged and playing a riskier game; a low number means they are playing it safe. | 147.6% | -12.0% | -6.2% |
| Current RatioThe 12-month survival check. It simply compares the cash they have right now (plus things they can quickly turn into cash) against the immediate bills they absolutely must pay this year. A score above 1 means they have enough in the wallet to cover the upcoming bills without panicking. | 1.75x | +9.6% | +0.9% |
| Total AssetsThe absolute size of the company's empire. It bundles together absolutely everything of value they own—from the cash in the register and the inventory in the warehouse, to the software patents in the vault and the factories on the ground. | $12.6B | +6.3% | +5.9% |
| Metric | Annual (A vs E) | Annual Surprise | Quarter (A vs E) | Quarter Surprise |
|---|---|---|---|---|
| EPS Surprise | 2.14 vs 2.15 | -0.6% | 1.38 vs 0.79 | +74.4% |
| Revenue Surprise | $15.4B vs $15.4B | -0.1% | $3.7B vs $4.0B | -9.1% |
| Date | Executive | Title | Security | Side | Shares | Price |
|---|---|---|---|---|---|---|
| Aug 31, 2026 | FISHER WILLIAM SYDNEY | director, 10 percent owner: | Common Stock | D | 6,004,089 | — |
| Aug 31, 2026 | FISHER WILLIAM SYDNEY | director, 10 percent owner: | Common Stock | A | 4,089 | — |
| Aug 22, 2026 | DICKSON RICHARD | director, officer: President & CEO, Gap Inc. | Common Stock | A | 116,502 | — |
| Aug 22, 2026 | DICKSON RICHARD | director, officer: President & CEO, Gap Inc. | Common Stock | A | 109,649 | — |
| Aug 22, 2026 | DICKSON RICHARD | director, officer: President & CEO, Gap Inc. | Common Stock | D | 62,852 | $19.80 |
Operator: Good afternoon, ladies and gentlemen. I would like to welcome everyone to the Gap Inc. Second Quarter 2026 Earnings Conference Call. [Operator Instructions] I would now like to introduce your host, Shirley Martin, Senior Director of Investor Relations. Shirley Martin: Good afternoon, everyone. Welcome to Gap Inc.'s Second Quarter Fiscal 2026 Earnings Conference Call. Before we begin, I'd like to remind you that the information made available on this conference call contains forward-looking statements that are subject to risks that could cause our actual results to be materially different. For information on factors that could cause our actual results to differ materially from any forward-looking statements, please refer to the cautionary statements contained in our latest earnings release. The risk factors described in the company's annual report on Form 10-K filed with the Securities and Exchange Commission on March 17, 2026, and other filings with the Securities and Exchange Commission, all of which are available on gapinc.com. These forward-looking statements are based on information as of today, August 27, 2026, and we assume no obligation to publicly update or revise our forward-looking statements. Our latest earnings release and the accompanying materials available on gapinc.com also include descriptions and where available reconciliations of financial measures not consistent with generally accepted accounting principles. All market data referenced today will be from Circana's U.S. apparel consumer service for the 12 months ending July 2026, unless otherwise stated. Joining me on the call today are our Chief Executive Officer, Richard Dickson; and Chief Financial Officer, Katrina O'Connell. With that, I'll turn the call over to Richard. Richard Dickson: Thanks, Shirley, and good afternoon, everyone. In the second quarter, while the company exceeded our profit expectations, we delivered a net sales decline of 2% with mixed performance on the top line across the portfolio. While not the revenue outcome we wanted, continued operational and financial rigor contributed to gross margin strength. We also maintained market share, reflecting the continued resonance of our brand portfolio. The Gap brand delivered another exceptional quarter with comparable sales increasing 10% and Banana Republic continued to build momentum, posting its fifth consecutive quarter of positive comps. Athleta's top line remained pressured, though we saw encouraging improvements in inventory productivity. At Old Navy, as we previewed on last quarter's call, seasonal categories continued to weigh on performance. While we took actions to address this as the quarter progressed, we also experienced a slowdown in traffic, which led to a modest miss versus our expectations. While this is disappointing, I have confidence in our plans to improve performance in the second half. Over the past quarter, Katrina and I have been deeply involved with the Old Navy team in …
| Name | Title | Compensation | Gender | Year Born | Status |
|---|---|---|---|---|---|
Richard Dickson | Chief Executive Officer, President & Director | USD 6,294,394 | Male | 1968 | Active |
Mark Breitbard | President & Chief Executive Officer of Gap Brand | USD 4,474,572 | Male | 1968 | Active |
Horacio Barbeito | President & Chief Executive Officer - Old Navy | USD 3,412,832 | Male | 1971 | Active |
Eric Kayen Chan | Executive Vice President and Chief Business & Strategy Officer | USD 3,352,822 | Male | 1978 | Active |
Katrina O'Connell | Executive Vice President & Chief Financial Officer | USD 3,249,760 | Female | 1970 | Active |
Julie Gruber | Executive Vice President, Chief Legal & Compliance Officer and Corporate Secretary | USD 1,369,263 | Female | 1966 | Active |
Sven Gerjets | Chief Technology Officer | — | Male | — | Active |
Amanda J. Thompson | Executive Vice President & Chief People Officer | — | Female | 1977 | Active |
Mame Annan-Brown | Chief Communications Officer | — | Female | — | Active |
Whitney Notaro | Head of Investor Relations | — | Female | — | Active |
Wondering how to pick strong, market-beating stocks for your investment portfolio? Look no further than the Zacks Style Scores.
SAN FRANCISCO, Aug. 4, 2026 /PRNewswire/ -- Gap Inc. (NYSE: GAP) will report its second quarter fiscal 2026 financial results by press release on Thursday, August 27, 2026, at approximately 1:15 p.m. Pacific Time.

The Zacks Style Scores offers investors a way to easily find top-rated stocks based on their investing style. Here's why you should take advantage.
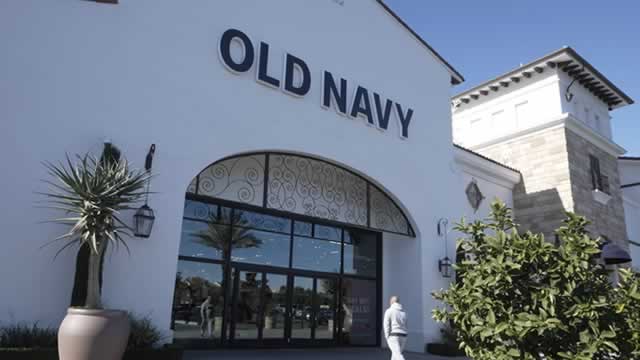
Bank of New York Mellon Corp reduced its stake in The Gap, Inc. (NYSE: GAP) by 2.0% during the first quarter, according to its most recent filing with the Securities and Exchange Commission (SEC). The firm owned 3,132,774 shares of the company's stock after selling 63,160 shares during the period. Bank of New
GAP trades at a discounted valuation as investors weigh weaker near-term guidance against AI investments and customer engagement initiatives.

| Report Date | Employees | Form Type | Filing Date | SEC Filing |
|---|---|---|---|---|
| Jan 31, 2026 | 79,000 | 10-K | Mar 17, 2026 | View |