
Zacks Investment Research8/17/2026Neutral
YPF, E & XRG Advance Argentina LNG Toward a Key Investment Milestone
YPF's Argentina LNG project advances with Eni and XRG, targeting 12 MTPA capacity and a potential new export-driven growth platform.

Eni S.p.A. is an international energy company primarily engaged in the discovery, development, and extraction of crude oil and natural gas resources. ...
Plutux is not an investment adviser. Market data and AI-generated analysis are for information and education only, not investment advice. Disclaimer
$0.53 per share
Est. EPS $1.54 · Revenue $21.75B · 2 analysts
Est. EPS $1.55
Est. EPS $1.28 · Revenue $21.53B · 2 analysts
EPS €2.18 · Revenue €22.67B
$0.53 per share
EPS €0.72 · Revenue €19.74B
EPS €1.56 · Revenue €82.15B
EPS €0.52 · Revenue €20.20B
EPS €0.32 · Revenue €18.77B
| Metric | Latest | YoYYoY means Year-over-Year. It compares the latest annual value with the previous annual value to show long-term trend strength. | QoQQoQ means Quarter-over-Quarter. It compares the latest quarter with the immediately previous quarter to show short-term momentum changes. |
|---|---|---|---|
| RevenueThe total money that came through the front door from selling things, before paying a single bill. Think of it as the grand total of every credit card swipe from customers. (YoY compares this year to last year's performance, while QoQ compares the current three months to the previous three). | $82.2B | -7.5% | +14.8% |
| Net IncomeThe absolute bottom line. If the company paid every single supplier, employee, banker, and tax collector, this is the actual money left in their pocket at the end of the day. | $2.6B | -0.6% | +215.2% |
| Gross MarginThe basic markup. If they sell a $100 pair of sneakers, this percentage tells you how much of that price tag is profit right after paying for the rubber and shoelaces, but before paying for things like store rent or TV commercials. | +9.4% | -27.5% | +111.7% |
| Operating MarginThe 'day job' efficiency score. Out of every dollar a customer spends, this shows how many cents the company keeps after making the product AND paying for all the everyday corporate overhead (like salaries, marketing, and keeping the lights on). | +5.5% | -52.1% | +63.0% |
| Net MarginThe final take-home percentage. When you strip away every conceivable cost, tax, and interest payment, this is the exact number of cents the company truly gets to keep from every dollar in sales. | +3.2% | +7.4% | +174.5% |
| Free Cash FlowThe holy grail of corporate cash. It's the spendable, physical money left over after the business pays for its daily operations AND buys the big, expensive upgrades (like new factories or servers) it needs to survive. This is the 'free' money they can use to pay dividends or buy back stock. | $4.6B | -9.0% | +331.4% |
| FCF MarginThe ultimate cash conversion rate. It shows how good the company is at turning regular sales directly into cold, hard, spendable cash. A high percentage means the business is an absolute cash-printing machine. | +5.6% | -1.7% | +301.6% |
| Debt / EquityThe financial risk gauge. It compares how much of the company's empire was built using borrowed money (loans) versus the owners' own money (shareholders). A high number means they are heavily leveraged and playing a riskier game; a low number means they are playing it safe. | 91.3% | +4.3% | -4.3% |
| Current RatioThe 12-month survival check. It simply compares the cash they have right now (plus things they can quickly turn into cash) against the immediate bills they absolutely must pay this year. A score above 1 means they have enough in the wallet to cover the upcoming bills without panicking. | 1.19x | +3.5% | +6.3% |
| Total AssetsThe absolute size of the company's empire. It bundles together absolutely everything of value they own—from the cash in the register and the inventory in the warehouse, to the software patents in the vault and the factories on the ground. | $139.2B | -7.3% | -0.5% |
| Metric | Annual (A vs E) | Annual Surprise | Quarter (A vs E) | Quarter Surprise |
|---|---|---|---|---|
| EPS Surprise | 1.56 vs 3.09 | -49.5% | 2.18 vs 1.54 | +41.7% |
| Revenue Surprise | $82.2B vs $86.6B | -5.1% | $22.7B vs $21.8B | +4.2% |
Operator : Good afternoon, ladies and gentlemen, and welcome to Eni's 2026 First Half Results Conference Call, hosted by Mr. Claudio Descalzi, Chief Executive Officer. [Operator Instructions] I am now handing you over to your host to begin today's conference. Thank you. Claudio Descalzi : Thank you. Good morning. Good afternoon for being with us today. Our second quarter and first half results clearly reflect our successful execution of the strategy and the objectives we have consistently communicated. In Q2, Eni generated EUR 5.4 billion pro forma EBIT and EUR 2.3 billion net income, both doubling year-on-year and EUR 4.5 billion of cash flow from operations, up over 60%. This growth significantly outpaced the increase in Brent prices over the same period, demonstrating the strength of our operating leverage and our ability to absorb a highly unfavorable foreign exchange environment. Looking at the first half of the year, we delivered a remarkable 40% year-on-year increase in pro forma EBIT. Reported gearing remained stable quarter-on-quarter, while pro forma gearing declined to 10%, reaching the lower end of our target range. Overall, this performance reflects excellent operational execution, effective capture of market opportunities and the continued delivery of our consistent strategy. The first half of 2026, marked by the emergence of a new crisis in the Gulf has once again exposed our industry to extraordinary volatility, yet Eni has demonstrated its ability to effectively mitigate external pressures. Our resilience is underpinned by a broad geographic diversification, strong operational efficiency and the deployment of proprietary technologies. At the same time, our robust organic growth continues to be fueled by our outstanding exploration success and a deep pipeline of development opportunities. Most importantly, our growth is increasingly multidimensional. While exploration and production remains our highly competitive core business, we are rapidly scaling attractive growth platforms right across the energy value chain. Specifically, I would like to highlight 3 key pillars of our strategy. First, diversification. We are well diversified across the geographies, businesses and technologies. While some of our operations have been affected by events in the Middle East, the overall impact has not been material. Actions taken in 2026 have further strengthened this diversification, increasing our exposure to Asia and South America, expanding our transition-related businesses and opening new opportunity in trading activities, critical minerals and stationary batteries. Second, growth. We continue to deliver a unique double engine of growth, combining industry-leading organic upstream production with a rapid parallel expansion in low-carbon energy. Third, financial performance. We continue to generate outstanding financial results with over 60% of our original plan targets already met year-to-date, also thanks to the fast time to market of our …
| Name | Title | Compensation | Gender | Year Born | Status |
|---|---|---|---|---|---|
Claudio Descalzi | Chief Executive Officer, GM & Director | EUR 7,258,848 | Male | 1955 | Active |
Francesco Gattei | Chief Transition & Financial Officer, Chief Operating Officer and GM | EUR 2,684,684 | Male | 1969 | Active |
Guido Brusco | Chief Operating Officer of Global Natural Resources & GM | EUR 2,556,014 | Male | 1970 | Active |
Claudia Carloni | Senior Vice President of International Negotiations - R&M business | — | Female | — | Active |
Jonathon Rigby | Head of Investor Relations & Strategic Analysis | — | Male | — | Active |
Luca Franceschini | Integrated Compliance Director, Board Counsel & Board Secretary | — | Male | 1966 | Active |
Lapo Pistelli | Director of Public Affairs | — | Male | 1964 | Active |
Francesco Esposito | Head of Accounting & Financial Statements | — | — | — | Active |
Lorenzo Fiorillo | Director of Technology, R&D & Digital | — | Male | 1974 | Active |
Stefano Speroni | Director of Legal Affairs & Commercial Negotiations | — | Male | 1962 | Active |
YPF's Argentina LNG project advances with Eni and XRG, targeting 12 MTPA capacity and a potential new export-driven growth platform.
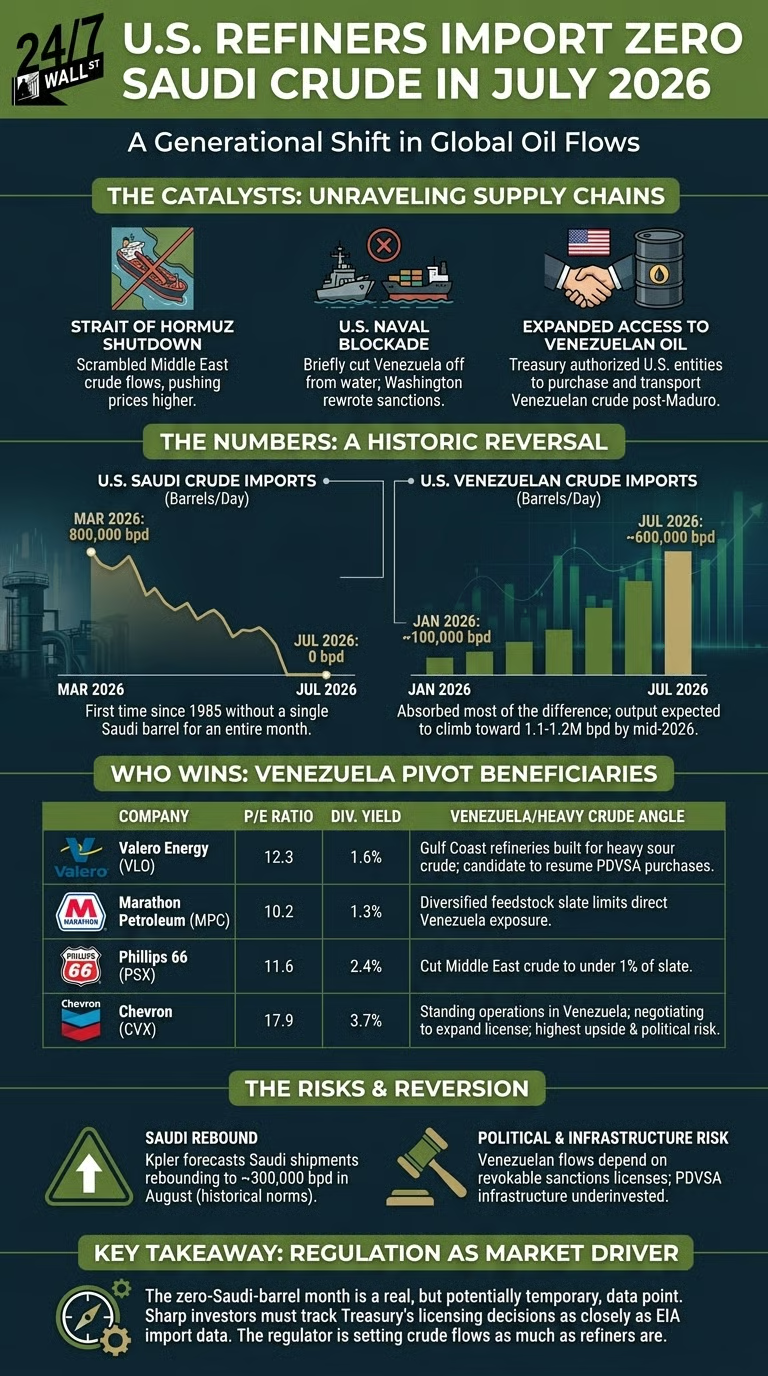
A 40-year streak just snapped, and it happened fast enough that most investors missed it entirely. The forces reshaping U.S. crude imports in 2026 point to a handful of refiners and one major sitting at the center of a political and commodity storm.
E's production growth, stronger cash flow and higher buybacks have fueled a sharp rally, but commodity exposure remains a key risk.
Investors need to pay close attention to E stock based on the movements in the options market lately.

This article is part of our monthly series where we highlight five large-cap, relatively safe, dividend-paying companies offering significant discounts to their historical norms. We go over our filtering process to select just five conservative DGI stocks from more than 7,500 companies that are traded on U.S. exchanges, including OTC networks. In addition to the primary list that yields 4.2%, we present two other groups of five DGI stocks each, from moderate to high yields of up to 8%.