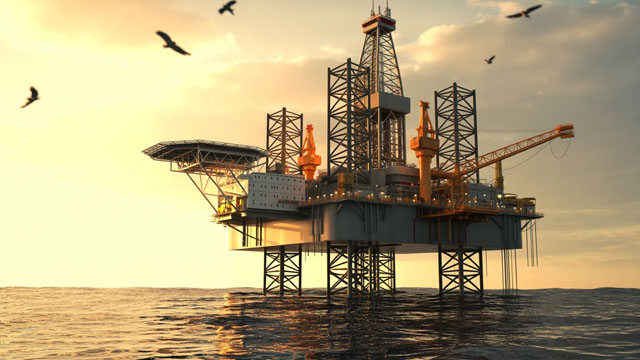
Ecopetrol SA engages in the exploration, development, and production of crude oil and natural gas. It operates through the following segments: Exploration ...
Ecopetrol S.A. (NYSE: EC) is an integrated hydrocarbons company headquartered in Bogotá, Colombia. The business spans the full value chain, including exploration and production (E&P) of crude oil and natural gas, transportation and logistics (notably pipeline and related midstream activities), and refining and petrochemical operations that convert crude into fuel ...Ecopetrol S.A. (NYSE: EC) is an integrated hydrocarbons company headquartered in Bogotá, Colombia. The business spans the full value chain, including exploration and production (E&P) of crude oil and natural gas, transportation and logistics (notably pipeline and related midstream activities), and refining and petrochemical operations that convert crude into fuel products and petrochemical feedstocks.
From a business perspective, Ecopetrol is positioned to capture value across upstream and downstream segments, which can help stabilize results when crude markets and refining margins move differently. Its operational model links the supply of produced hydrocarbons to domestic transportation and refining capabilities, supporting the company’s role in meeting energy demand in Colombia and serving regional needs.
Product and service scope includes: (1) crude oil and natural gas production, (2) transportation/logistics through pipelines and related infrastructure, and (3) refining and petrochemical product manufacturing, with outputs such as motor fuels, fuel oils, and petrochemicals. This integrated structure typically involves capital-intensive assets (fields, pipelines, refineries), ongoing maintenance and safety compliance, and continuous operational planning around production volumes and downstream utilization.
On cost and operations, the company’s performance depends heavily on commodity prices, operating efficiency, and energy/inputs used in production and refining. Like other integrated oil and gas firms, Ecopetrol’s cost base is influenced by lifting costs, transportation tariffs/throughput economics, refinery maintenance turnaround schedules, and working capital dynamics driven by receivables and inventory levels. Capital expenditure (capex) programs are central to sustaining and growing production as well as maintaining and upgrading midstream and refining assets.
Financially, the provided metrics indicate Ecopetrol is a large-cap public company with substantial market capitalization and meaningful profitability and cash generation characteristics typical of integrated operators. Key financial considerations for investors generally include leverage, interest coverage, free cash flow conversion, and the balance between shareholder distributions (dividends) and reinvestment needs.
Regarding key people, the dataset lists Juan Carlos Hurtado Parra as CEO. Ecopetrol’s strategic direction is also shaped by long-term planning initiatives (e.g., multi-year operational and financial goals) that guide investment priorities across upstream projects, midstream capacity, and refining/petrochemical development.
Overall, Ecopetrol’s goal is to remain a competitive integrated energy provider by managing the energy transition while strengthening core hydrocarbon operations—balancing production growth, asset reliability, and disciplined capital allocation—so it can sustain long-term value creation for stakeholders.
YoYYoY means Year-over-Year. It compares the latest annual value with the previous annual value to show long-term trend strength.
QoQQoQ means Quarter-over-Quarter. It compares the latest quarter with the immediately previous quarter to show short-term momentum changes.
RevenueThe total money that came through the front door from selling things, before paying a single bill. Think of it as the grand total of every credit card swipe from customers. (YoY compares this year to last year's performance, while QoQ compares the current three months to the previous three).
$111481.6B
-16.4%
+30.8%
Net IncomeThe absolute bottom line. If the company paid every single supplier, employee, banker, and tax collector, this is the actual money left in their pocket at the end of the day.
$8395.5B
-39.3%
+95.6%
Gross MarginThe basic markup. If they sell a $100 pair of sneakers, this percentage tells you how much of that price tag is profit right after paying for the rubber and shoelaces, but before paying for things like store rent or TV commercials.
+31.4%
-10.5%
+3.2%
Operating MarginThe 'day job' efficiency score. Out of every dollar a customer spends, this shows how many cents the company keeps after making the product AND paying for all the everyday corporate overhead (like salaries, marketing, and keeping the lights on).
+22.3%
-22.8%
+6.3%
Net MarginThe final take-home percentage. When you strip away every conceivable cost, tax, and interest payment, this is the exact number of cents the company truly gets to keep from every dollar in sales.
+7.5%
-27.5%
+49.6%
Free Cash FlowThe holy grail of corporate cash. It's the spendable, physical money left over after the business pays for its daily operations AND buys the big, expensive upgrades (like new factories or servers) it needs to survive. This is the 'free' money they can use to pay dividends or buy back stock.
$16195.0B
-50.2%
+6.7%
FCF MarginThe ultimate cash conversion rate. It shows how good the company is at turning regular sales directly into cold, hard, spendable cash. A high percentage means the business is an absolute cash-printing machine.
+14.5%
-40.5%
-18.4%
Debt / EquityThe financial risk gauge. It compares how much of the company's empire was built using borrowed money (loans) versus the owners' own money (shareholders). A high number means they are heavily leveraged and playing a riskier game; a low number means they are playing it safe.
130.4%
-9.0%
-8.9%
Current RatioThe 12-month survival check. It simply compares the cash they have right now (plus things they can quickly turn into cash) against the immediate bills they absolutely must pay this year. A score above 1 means they have enough in the wallet to cover the upcoming bills without panicking.
1.55x
+1.2%
+20.1%
Total AssetsThe absolute size of the company's empire. It bundles together absolutely everything of value they own—from the cash in the register and the inventory in the warehouse, to the software patents in the vault and the factories on the ground.
Operator: Good morning. My name is Natalia, and I will be your operator today. Welcome to Ecopetrol's earnings conference call, in which we will discuss the main financial and operating results of the second quarter of 2026. There will be a question-and-answer session at the end of the presentation. Before we begin, it is important to mention that the comments in this call by Ecopetrol's senior management include projections of the company's future performance. These projections do not constitute any commitment as to future results nor do they take into account risks or uncertainties that could materialize. As a result, Ecopetrol assumes no responsibility in the event that future results are different from the projections shared on this conference call. The call will be led by Mr. Juan Carlos Hurtado, acting CEO of Ecopetrol; Camilo Barco, CFO; and Carlos Mauricio Avila, Acting Executive Vice President of Hydrocarbons. Thank you for your attention. Mr. Hurtado, you may begin your conference.
Juan Carlos Parra: Welcome to Ecopetrol Group's Second Quarter 2026 Earnings Conference Call. This is Juan Carlos Hurtado Parra, Acting Chief Executive Officer of Ecopetrol Group. During the second quarter, Ecopetrol Group successfully capitalized on a favorable international crude oil and fuels market environment, supported by the strength of our integrated business model, differentiated commercial strategy and disciplined operational execution. As a result, we delivered COP 4.2 trillion in revenue, COP 17.7 trillion in EBITDA and COP 6.1 trillion in net income, representing increases of 35%, 59% and 235%, respectively, compared with the same period last year. These results reflect our ability to capture value across the entire value chain and were primarily driven by 3 factors: first, a favorable pricing environment with Brent averaging USD 97 per barrel and a strong recovery in international refining margins. Second, differentiated commercial management, which enabled us to improve our crude oil differentials by USD 3.67 per barrel compared to the first quarter despite a challenging environment for heavy crude grades. And third, strong operational execution in transportation and refining with the latter making a significant contribution to value creation during the quarter. Regarding investments, we continue advancing according to plan. As of June, we had executed USD 2.9 billion, maintaining our focus on production, energy security, strategic infrastructure and energy transition projects that support the group's competitiveness and future growth. Additionally, during the first half of the year, we complied with the dividend payment schedule approved by the General Shareholders' Meeting, reaffirming our commitment to the value creation for all shareholders. With respect to the Fuel Price Stabilization Fund, during the quarter, we received COP 1 trillion payment corresponding to the accrual of the second quarter of 2025. Furthermore, higher international …