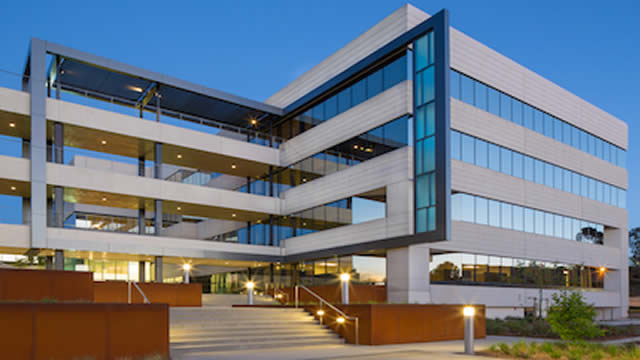
Douglas Emmett, Inc. is a publicly traded real estate investment trust focused on high-quality commercial and residential properties in premier coastal submarkets. The company’s operating platform centers on owning and managing Class A office buildings and multifamily communities in Los Angeles and Honolulu, markets characterized by limited land availability, high ...Douglas Emmett, Inc. is a publicly traded real estate investment trust focused on high-quality commercial and residential properties in premier coastal submarkets. The company’s operating platform centers on owning and managing Class A office buildings and multifamily communities in Los Angeles and Honolulu, markets characterized by limited land availability, high barriers to new construction, affluent populations, executive housing demand, and extensive lifestyle amenities. Its portfolio strategy emphasizes properties in desirable neighborhoods where location, building quality, and scarcity can support long-term occupancy and rental-rate performance.
The company’s office business provides leased workspace for corporate, professional-services, entertainment, technology, financial, and other tenants. Douglas Emmett also offers associated services such as parking and storage rentals, property management, maintenance, tenant improvements, and other building-related services. Its multifamily operations consist primarily of luxury apartment communities, with revenue generated from residential rents and ancillary property services. The combination of office and apartment assets gives the company exposure to both commercial leasing and housing demand, although office-market conditions remain an important factor in overall performance.
Douglas Emmett traces its operating heritage to 1971, when Dan Emmett and partners formed predecessor real estate companies. The public company was formed as a Maryland corporation in 2005 and completed its initial public offering in 2006. Jordan L. Kaplan serves as Chairman and Chief Executive Officer, while Dan Emmett is associated with the company’s founding and predecessor organizations. The company is headquartered at 1299 Ocean Avenue in Santa Monica, California, and reported approximately 778 full-time employees.
From a financial perspective, the supplied trailing-twelve-month data indicates approximately $7.35 billion of enterprise value and approximately $1.96 billion of equity market capitalization at the referenced price. The company reported roughly $0.76 in annualized dividends per share, corresponding to a dividend yield of approximately 6.5% based on the supplied data. Its reported operating profile includes positive operating cash flow and free cash flow, while net income and several earnings-based ratios were negative in the cited period. Debt is significant relative to market capitalization, as is common among property REITs, and the reported debt-to-assets ratio was approximately 60%. Capital needs include property maintenance, tenant improvements, redevelopment, acquisitions, and financing costs. In practical terms, Douglas Emmett’s performance depends on occupancy, rental rates, lease renewals, tenant credit quality, property values, interest rates, refinancing conditions, capital access, and the long-term recovery or stabilization of demand for high-quality office space.
YoYYoY means Year-over-Year. It compares the latest annual value with the previous annual value to show long-term trend strength.
QoQQoQ means Quarter-over-Quarter. It compares the latest quarter with the immediately previous quarter to show short-term momentum changes.
RevenueThe total money that came through the front door from selling things, before paying a single bill. Think of it as the grand total of every credit card swipe from customers. (YoY compares this year to last year's performance, while QoQ compares the current three months to the previous three).
$1.0B
+1.8%
+2.2%
Net IncomeThe absolute bottom line. If the company paid every single supplier, employee, banker, and tax collector, this is the actual money left in their pocket at the end of the day.
$16.3M
-30.8%
-7.3%
Gross MarginThe basic markup. If they sell a $100 pair of sneakers, this percentage tells you how much of that price tag is profit right after paying for the rubber and shoelaces, but before paying for things like store rent or TV commercials.
+63.4%
-1.8%
-0.8%
Operating MarginThe 'day job' efficiency score. Out of every dollar a customer spends, this shows how many cents the company keeps after making the product AND paying for all the everyday corporate overhead (like salaries, marketing, and keeping the lights on).
+19.0%
-9.5%
+0.6%
Net MarginThe final take-home percentage. When you strip away every conceivable cost, tax, and interest payment, this is the exact number of cents the company truly gets to keep from every dollar in sales.
+1.6%
-32.0%
-5.0%
Free Cash FlowThe holy grail of corporate cash. It's the spendable, physical money left over after the business pays for its daily operations AND buys the big, expensive upgrades (like new factories or servers) it needs to survive. This is the 'free' money they can use to pay dividends or buy back stock.
$194.5M
+14.9%
+34.8%
FCF MarginThe ultimate cash conversion rate. It shows how good the company is at turning regular sales directly into cold, hard, spendable cash. A high percentage means the business is an absolute cash-printing machine.
+19.4%
+12.9%
+31.8%
Debt / EquityThe financial risk gauge. It compares how much of the company's empire was built using borrowed money (loans) versus the owners' own money (shareholders). A high number means they are heavily leveraged and playing a riskier game; a low number means they are playing it safe.
292.3%
+9.2%
+4.7%
Current RatioThe 12-month survival check. It simply compares the cash they have right now (plus things they can quickly turn into cash) against the immediate bills they absolutely must pay this year. A score above 1 means they have enough in the wallet to cover the upcoming bills without panicking.
3.05x
-36.6%
-16.2%
Total AssetsThe absolute size of the company's empire. It bundles together absolutely everything of value they own—from the cash in the register and the inventory in the warehouse, to the software patents in the vault and the factories on the ground.
Operator: Ladies and gentlemen, thank you for standing by. Welcome to Douglas Emmett Quarterly Earnings Call. Today's call is being recorded. At this time, all participants are in listen only mode. After management's prepared remarks, you will receive instructions for participating in the question and answer session. I will now turn the conference over to Stuart McElhinney, Vice President of Investor Relations for Douglas Emmett.
Stuart McElhinney: Thank you. Joining us today on the call are Jordan L. Kaplan, our Chairman and CEO Kevin Andrew Crummy, our CIO and Peter D. Seymour, our CFO. This call is being webcast live from our website and will be available for replay during the next 90 days. You can also find our earnings package at the Investor Relations section of our website. You can find reconciliations of non GAAP financial measures discussed during today's call in the earnings package. During this call, we will make forward looking statements. These forward looking statements are based on the beliefs of assumptions made by and information currently available to us. Our actual results will be affected by known and unknown risks, trends, uncertainties and factors that are beyond our control or ability to predict. Although we believe that our assumptions are reasonable, they are not guarantees of future performance and some will prove to be incorrect. Therefore, our actual future results can be expected to differ from our expectations and those differences may be material. For a more detailed description of some potential risks, please refer to our SEC filings which can be found in the Investor Relations section of our website. When we reach the question and answer portion in consideration of others, please limit yourself to 1 question and 1 follow-up. Thank you. Will now turn the call over to Jordan.
Jordan L. Kaplan: Good morning and thank you for joining us. We had a very active quarter and made real progress on all 4 of our strategic priorities. Our leasing up our office portfolio, acquiring properties at attractive pricing, redeveloping properties to maximize value and refinancing upcoming debt maturities. We signed 960 thousand square feet of office leases. With a good mix of new and renewal deals. And achieved positive absorption of approximately 60 thousand square feet. Healthy office rents and low concessions helped us sign new leases that were 3% more valuable than the expiring leases they replaced. Of course, most of the positive impact of this leasing will occur over the next 12 months. Our apartment portfolio remains fully leased increasing rents. On the acquisition front, we and a few of our joint venture partners acquired an extremely well leased block of prime Beverly Hills medical office properties. Our redevelopment efforts are exceeding expectations Studio Plaza in Burbank, is now leased well over 50% So we have moved it from development to in service. Our apartment redevelopment projects are on track to add over 1 …