GuruFocus8/6/2026Neutral
Vistance Networks Reports Second Quarter 2026 Results
Vistance Networks, Inc. (NASDAQ: VISN), a global leading provider of intelligent network solutions, today reported results for the quarter ended June 30, 2026.*

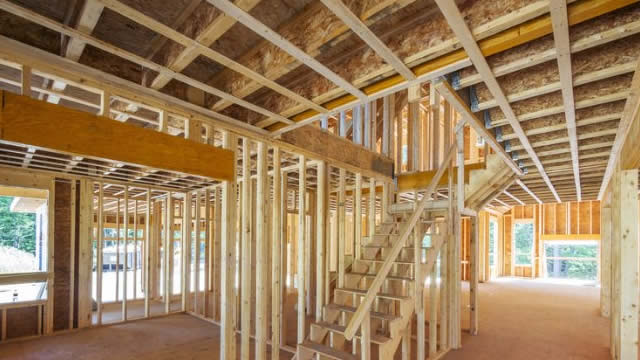
Century Communities, Inc. is a residential housing company that designs, builds, markets, and sells single-family homes, encompassing both attached and detached structures. ...
Plutux is not an investment adviser. Market data and AI-generated analysis are for information and education only, not investment advice. Disclaimer
$1.22 per share
Est. EPS $1.23 · Revenue $949.85M · 1 analysts
Est. EPS $1.22
Est. EPS $1.51 · Revenue $1.11B · 1 analysts
$1.22 per share
| Metric | Latest | YoYYoY means Year-over-Year. It compares the latest annual value with the previous annual value to show long-term trend strength. | QoQQoQ means Quarter-over-Quarter. It compares the latest quarter with the immediately previous quarter to show short-term momentum changes. |
|---|---|---|---|
| RevenueThe total money that came through the front door from selling things, before paying a single bill. Think of it as the grand total of every credit card swipe from customers. (YoY compares this year to last year's performance, while QoQ compares the current three months to the previous three). | $4.1B | -6.4% | +17.4% |
| Net IncomeThe absolute bottom line. If the company paid every single supplier, employee, banker, and tax collector, this is the actual money left in their pocket at the end of the day. | $147.6M | -55.8% | +48.1% |
| Gross MarginThe basic markup. If they sell a $100 pair of sneakers, this percentage tells you how much of that price tag is profit right after paying for the rubber and shoelaces, but before paying for things like store rent or TV commercials. | +21.4% | -2.1% | -13.9% |
| Operating MarginThe 'day job' efficiency score. Out of every dollar a customer spends, this shows how many cents the company keeps after making the product AND paying for all the everyday corporate overhead (like salaries, marketing, and keeping the lights on). | +9.2% | -9.7% | -40.0% |
| Net MarginThe final take-home percentage. When you strip away every conceivable cost, tax, and interest payment, this is the exact number of cents the company truly gets to keep from every dollar in sales. | +3.6% | -52.8% | +26.1% |
| Free Cash FlowThe holy grail of corporate cash. It's the spendable, physical money left over after the business pays for its daily operations AND buys the big, expensive upgrades (like new factories or servers) it needs to survive. This is the 'free' money they can use to pay dividends or buy back stock. | $124.3M | +43.3% | +44.0% |
| FCF MarginThe ultimate cash conversion rate. It shows how good the company is at turning regular sales directly into cold, hard, spendable cash. A high percentage means the business is an absolute cash-printing machine. | +3.0% | +53.1% | +52.3% |
| Debt / EquityThe financial risk gauge. It compares how much of the company's empire was built using borrowed money (loans) versus the owners' own money (shareholders). A high number means they are heavily leveraged and playing a riskier game; a low number means they are playing it safe. | 55.7% | -1.1% | +9.6% |
| Current RatioThe 12-month survival check. It simply compares the cash they have right now (plus things they can quickly turn into cash) against the immediate bills they absolutely must pay this year. A score above 1 means they have enough in the wallet to cover the upcoming bills without panicking. | 4.15x | -54.5% | +11.8% |
| Total AssetsThe absolute size of the company's empire. It bundles together absolutely everything of value they own—from the cash in the register and the inventory in the warehouse, to the software patents in the vault and the factories on the ground. | $4.5B | -1.0% | +4.0% |
| Metric | Annual (A vs E) | Annual Surprise | Quarter (A vs E) | Quarter Surprise |
|---|---|---|---|---|
| EPS Surprise | 4.86 vs 5.44 | -10.6% | 1.25 vs 0.64 | +95.3% |
| Revenue Surprise | $4.1B vs $3.9B | +4.9% | $927.2M vs $857.2M | +8.2% |
| Date | Executive | Title | Security | Side | Shares | Price |
|---|---|---|---|---|---|---|
| Aug 1, 2026 | DIXON JOHN SCOTT | officer: Chief Financial Officer | Common Stock | A | 59 | — |
| Aug 1, 2026 | DIXON JOHN SCOTT | officer: Chief Financial Officer | Common Stock | A | 1,649 | — |
| Aug 1, 2026 | DIXON JOHN SCOTT | officer: Chief Financial Officer | Common Stock | D | 748 | $67.16 |
| Aug 1, 2026 | DIXON JOHN SCOTT | officer: Chief Financial Officer | Retricted Stock Units | D | 1,649 | — |
| Aug 1, 2026 | DIXON JOHN SCOTT | officer: Chief Financial Officer | Dividend Equivalent Rights | D | 59 | — |
Operator : Greetings. Welcome to the Century Communities Second Quarter 2026 Earnings Conference Call. Please note, this conference call is being recorded. I will now turn the conference over to Tyler Langton, Senior Vice President of Investor Relations for Century Communities. Thank you. You may begin. Tyler Langton : Good afternoon. Thank you for joining us today for Century Communities Earnings Conference Call for the Second Quarter 2026. Before the call begins, I would like to remind everyone that certain statements made during this call may constitute forward-looking statements. These statements are based on management's current expectations and are subject to a number of risks and uncertainties that could cause actual results to differ materially from those described or implied in the forward-looking statements. Certain of these risks and uncertainties can be found under the heading Risk Factors in the company's latest 10-K as supplemented by our latest 10-Q to be filed shortly and other SEC filings. We undertake no duty to update our forward-looking statements. Additionally, certain non-GAAP financial measures will be discussed on this conference call. Reconciliations of all non-GAAP measures to the most directly comparable GAAP measures are included in the earnings release furnished to the SEC and posted on our Investor Relations website. The company's presentation of this information is not intended to be considered in isolation or as a substitute for the financial information presented in accordance with GAAP. Hosting the call today are Dale Francescon, Executive Chairman; Rob Francescon, Chief Executive Officer; and Scott Dixon, Chief Financial Officer. Following today's prepared remarks, we will open up the line for questions. With that, I'll turn the call over to Dale. Dale Francescon : Thank you, Tyler and good afternoon, everyone. We delivered strong second quarter results despite continued headwinds from macro challenges and weak consumer sentiment, with earnings per diluted share of $1.26, increasing by 11% on a year-over-year basis and 50% sequentially. Our deliveries of 2,506 homes exceeded our guidance of 2,200 to 2,400 on a stronger absorption rate, which increased by 6% on a quarter-over-quarter basis compared to a historic average second quarter decline of 7% over the previous 5 years. We coupled this improvement in our sales pace with effective management of our incentives and costs. Our adjusted gross margin of 20% increased by 30 basis points on a sequential basis, benefiting from lower incentives and direct costs. We also continued to successfully control our fixed general and administrative costs, while our financial services business generated strong results. As a result, we grew our book value per share to a company record of $90.24. We ended the quarter with a company record 330 open communities and expect our average community count in 2026 to increase in the low to mid-single-digit percentage range on a …
| Name | Title | Compensation | Gender | Year Born | Status |
|---|---|---|---|---|---|
Robert J. Francescon | Chief Executive Officer, President & Director | USD 3,888,654 | Male | 1958 | Active |
Dale Francescon | Executive Chairman | USD 3,270,435 | Male | 1953 | Active |
John Scott Dixon | Chief Financial Officer | USD 1,752,785 | Male | 1980 | Active |
Tyler J. Langton | Senior Vice President of Investor Relations | — | Male | — | Active |
Vistance Networks, Inc. (NASDAQ: VISN), a global leading provider of intelligent network solutions, today reported results for the quarter ended June 30, 2026.*
Century Communities (CCS) could be a great choice for investors looking to buy stocks that have gained strong momentum recently but are still trading at reasonable prices. It is one of the several stocks that made it through our 'Fast-Paced Momentum at a Bargain' screen.

First Trust Advisors LP boosted its holdings in Century Communities, Inc. (NYSE: CCS) by 14.1% during the first quarter, according to its most recent Form 13F filing with the Securities and Exchange Commission. The fund owned 74,328 shares of the construction company's stock after acquiring an additional 9,159 shares during the period. First
Woodside Energy Group (ASX: WDS) (NYSE: WDS):2026 full-year guidancePriorCurrentTotal production volumes3MMboe172-186174-185Gas hub exposure4%~30No changeCapita

Here is how Century Communities (CCS) and Innodata Inc (INOD) have performed compared to their sector so far this year.