
Zacks Investment Research8/5/2026Neutral
KB Home (KBH) Advances While Market Declines: Some Information for Investors
In the most recent trading session, KB Home (KBH) closed at $58.96, indicating a +1.57% shift from the previous trading day.
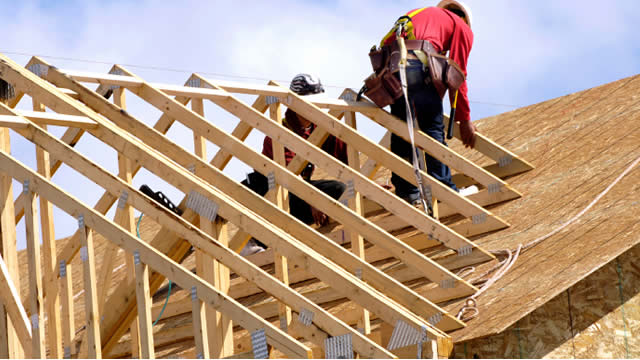
KB Home functions as a prominent residential construction enterprise across the United States. Its operations are strategically divided into four key geographical ...
Plutux is not an investment adviser. Market data and AI-generated analysis are for information and education only, not investment advice. Disclaimer
Est. EPS $0.88
Est. EPS $3.33 · Revenue $5.12B · 11 analysts
Est. EPS $0.71 · Revenue $1.16B · 3 analysts
Est. EPS $0.90 · Revenue $1.33B · 3 analysts
$1.00 per share
$1.00 per share
| Metric | Latest | YoYYoY means Year-over-Year. It compares the latest annual value with the previous annual value to show long-term trend strength. | QoQQoQ means Quarter-over-Quarter. It compares the latest quarter with the immediately previous quarter to show short-term momentum changes. |
|---|---|---|---|
| RevenueThe total money that came through the front door from selling things, before paying a single bill. Think of it as the grand total of every credit card swipe from customers. (YoY compares this year to last year's performance, while QoQ compares the current three months to the previous three). | $6.2B | -10.0% | +3.3% |
| Net IncomeThe absolute bottom line. If the company paid every single supplier, employee, banker, and tax collector, this is the actual money left in their pocket at the end of the day. | $428.8M | -34.5% | -18.2% |
| Gross MarginThe basic markup. If they sell a $100 pair of sneakers, this percentage tells you how much of that price tag is profit right after paying for the rubber and shoelaces, but before paying for things like store rent or TV commercials. | +18.8% | -11.6% | +0.6% |
| Operating MarginThe 'day job' efficiency score. Out of every dollar a customer spends, this shows how many cents the company keeps after making the product AND paying for all the everyday corporate overhead (like salaries, marketing, and keeping the lights on). | +8.4% | -25.7% | -14.9% |
| Net MarginThe final take-home percentage. When you strip away every conceivable cost, tax, and interest payment, this is the exact number of cents the company truly gets to keep from every dollar in sales. | +6.9% | -27.3% | -20.8% |
| Free Cash FlowThe holy grail of corporate cash. It's the spendable, physical money left over after the business pays for its daily operations AND buys the big, expensive upgrades (like new factories or servers) it needs to survive. This is the 'free' money they can use to pay dividends or buy back stock. | $287.3M | -11.2% | +116.0% |
| FCF MarginThe ultimate cash conversion rate. It shows how good the company is at turning regular sales directly into cold, hard, spendable cash. A high percentage means the business is an absolute cash-printing machine. | +4.6% | -1.3% | +115.5% |
| Debt / EquityThe financial risk gauge. It compares how much of the company's empire was built using borrowed money (loans) versus the owners' own money (shareholders). A high number means they are heavily leveraged and playing a riskier game; a low number means they are playing it safe. | 44.4% | +5.3% | +5.6% |
| Current RatioThe 12-month survival check. It simply compares the cash they have right now (plus things they can quickly turn into cash) against the immediate bills they absolutely must pay this year. A score above 1 means they have enough in the wallet to cover the upcoming bills without panicking. | 4.57x | -34.4% | +6.8% |
| Total AssetsThe absolute size of the company's empire. It bundles together absolutely everything of value they own—from the cash in the register and the inventory in the warehouse, to the software patents in the vault and the factories on the ground. | $6.7B | -3.1% | +1.1% |
| Metric | Annual (A vs E) | Annual Surprise | Quarter (A vs E) | Quarter Surprise |
|---|---|---|---|---|
| EPS Surprise | 6.15 vs 6.40 | -3.9% | 0.43 vs 0.89 | -51.9% |
| Revenue Surprise | $6.2B vs $6.2B | +0.6% | $1.1B vs $1.3B | -14.2% |
| Date | Executive | Title | Security | Side | Shares | Price |
|---|---|---|---|---|---|---|
| Aug 6, 2026 | Collins Arthur Reginald | director | Common Stock | D | 4,000 | $56.96 |
| Aug 5, 2026 | PRAW ALBERT Z | officer: EVP, Real Estate & Bus. Dev. | Common Stock | D | 22,015 | $58.70 |
| Jul 15, 2026 | MEZGER JEFFREY T | director, officer: Executive Chairman | Common Stock | A | 51,018 | $16.21 |
| Jul 15, 2026 | MEZGER JEFFREY T | director, officer: Executive Chairman | Common Stock | D | 21,010 | $56.24 |
| Jul 15, 2026 | MEZGER JEFFREY T | director, officer: Executive Chairman | Common Stock | D | 30,008 | $56.70 |
Operator: Good afternoon. My name is John, and I will be your conference operator today. I would like to welcome everyone to the KB Home 26 Second Quarter Earnings Conference Call. All participant lines are in a listen-only mode. Following the company's opening remarks, we will open the lines for questions. This conference call is being recorded and a replay will be on the KB Home website until July 23, 2026. We will now turn the call over to Jill S. Peters, senior Vice President, Investor Relations. Thank you, Jill. You may begin. Jill S. Peters: Thank you, John. Good afternoon, everyone, and thank you for joining us today to review our results for the second quarter of fiscal 26. On the call are Jeffrey T. Mezger, Executive Chairman; Robert V. McGibney, President and Chief Executive Officer; William R. Hollinger, Senior Vice President and Chief Accounting Officer; and Thad Johnson, senior vice president and treasurer. During this call, items will be discussed that are considered forward looking statements within the meaning of the Private Securities Litigation Reform Act of 2 thousand. These statements are not guarantees of future results and the company does not undertake any obligation to update them. Due to various factors, including those detailed in today's press release, and in our filings with the Securities and Exchange Commission, actual results could be materially different from those stated or implied in the forward looking statements. In addition, an explanation and or reconciliation of the non GAAP measure of adjusted housing gross profit margin as well as any other non GAAP measure referenced during today's discussion to its most directly comparable GAAP measure can be found in today's press release and/or on the Investor Relations page of our site at kbhome.com. And finally, please note all figures are based on our quarter ended May 31 and all comparisons are on a year over year basis unless otherwise stated. And with that, here is Jeffrey T. Mezger. Jeffrey T. Mezger: Thank you, Jill, and good afternoon, everyone. We are pleased to report second quarter results that met or exceeded the midpoint of our key guidance ranges and reflected sequential improvement in our adjusted housing gross profit margin. Operationally, our execution remains strong as we achieved double digit year over year community count growth, and further reduced our build times. We exceeded our expected mix of built to order sales during the quarter And with the return to this core business model, we expect to have more predictability in deliveries at better gross margins than we would achieve by relying on selling inventory homes. At a high level, our second quarter results included total revenues of $1.1 billion and diluted earnings per share of $0.43. With our significant financial flexibility, we remain balanced in our capital allocation, investing for growth, while also returning capital to our shareholders. We repurchased 1.4 million shares of our common …
| Name | Title | Compensation | Gender | Year Born | Status |
|---|---|---|---|---|---|
Jeffrey T. Mezger | Executive Chairman | USD 7,082,761 | Male | 1956 | Active |
Robert V. McGibney | CEO, President & Director | USD 3,811,578 | Male | 1975 | Active |
Albert Z. Praw | Executive Vice President of Real Estate & Business Development | USD 2,139,472 | Male | 1949 | Active |
Brian J. Woram | Executive Vice President & General Counsel | USD 2,038,320 | Male | 1961 | Active |
William R. Hollinger | Senior Vice President & Chief Accounting Officer | USD 1,111,303 | Male | 1959 | Active |
Dan Bridleman | Senior Vice President of Sustainability, Technology & Strategic Sourcing | — | Male | — | Active |
Jill S. Peters | Senior Vice President of Investor Relations | — | Female | — | Active |
Amit Desai | Senior Vice President & Chief Marketing Officer | — | Male | — | Active |
Thomas F. Norton | Senior Vice President of Human Resources | — | Male | 1971 | Active |
Vince DePorre | Southeast Regional President | — | Male | — | Active |
In the most recent trading session, KB Home (KBH) closed at $58.96, indicating a +1.57% shift from the previous trading day.
New community, priced from the $590Ks and featuring resort-style amenities, is now open for tours. FAIRFIELD, Calif.

Two new communities with resort-style amenities and close to award-winning schools are now open for tours. VALENCIA, Calif.

/PRNewswire/ -- KB Home (NYSE: KBH), one of the largest and most trusted homebuilders in the U.S., today announced the opening of Elowen, a new gated community

KB Home (KBH) reached $56.35 at the closing of the latest trading day, reflecting a -1.21% change compared to its last close.