
WSJ8/25/2026Neutral
How Cava Handles Food Safety
Plus, Trump threatens 50% tariff on automobiles and parts from Canada.
CAVA Group, Inc. is a company that oversees and runs a chain of Mediterranean restaurants. Their culinary offerings encompass a range of ...
Plutux is not an investment adviser. Market data and AI-generated analysis are for information and education only, not investment advice. Disclaimer
Est. EPS $0.55 · Revenue $1.50B · 21 analysts
Est. EPS $0.74 · Revenue $1.82B · 21 analysts
Est. EPS $0.48 · Revenue $724.28M · 8 analysts
Est. EPS $1.03 · Revenue $2.20B · 11 analysts
| Metric | Latest | YoYYoY means Year-over-Year. It compares the latest annual value with the previous annual value to show long-term trend strength. | QoQQoQ means Quarter-over-Quarter. It compares the latest quarter with the immediately previous quarter to show short-term momentum changes. |
|---|---|---|---|
| RevenueThe total money that came through the front door from selling things, before paying a single bill. Think of it as the grand total of every credit card swipe from customers. (YoY compares this year to last year's performance, while QoQ compares the current three months to the previous three). | $1.2B | +22.4% | -15.9% |
| Net IncomeThe absolute bottom line. If the company paid every single supplier, employee, banker, and tax collector, this is the actual money left in their pocket at the end of the day. | $63.7M | -51.1% | -2.3% |
| Gross MarginThe basic markup. If they sell a $100 pair of sneakers, this percentage tells you how much of that price tag is profit right after paying for the rubber and shoelaces, but before paying for things like store rent or TV commercials. | +18.4% | -26.8% | +32.6% |
| Operating MarginThe 'day job' efficiency score. Out of every dollar a customer spends, this shows how many cents the company keeps after making the product AND paying for all the everyday corporate overhead (like salaries, marketing, and keeping the lights on). | +6.7% | +50.3% | -7.9% |
| Net MarginThe final take-home percentage. When you strip away every conceivable cost, tax, and interest payment, this is the exact number of cents the company truly gets to keep from every dollar in sales. | +5.4% | -60.0% | +16.2% |
| Free Cash FlowThe holy grail of corporate cash. It's the spendable, physical money left over after the business pays for its daily operations AND buys the big, expensive upgrades (like new factories or servers) it needs to survive. This is the 'free' money they can use to pay dividends or buy back stock. | $26.1M | -50.6% | +89.2% |
| FCF MarginThe ultimate cash conversion rate. It shows how good the company is at turning regular sales directly into cold, hard, spendable cash. A high percentage means the business is an absolute cash-printing machine. | +2.2% | -59.6% | +125.1% |
| Debt / EquityThe financial risk gauge. It compares how much of the company's empire was built using borrowed money (loans) versus the owners' own money (shareholders). A high number means they are heavily leveraged and playing a riskier game; a low number means they are playing it safe. | 59.8% | +9.8% | +0.6% |
| Current RatioThe 12-month survival check. It simply compares the cash they have right now (plus things they can quickly turn into cash) against the immediate bills they absolutely must pay this year. A score above 1 means they have enough in the wallet to cover the upcoming bills without panicking. | 2.65x | -10.8% | -6.4% |
| Total AssetsThe absolute size of the company's empire. It bundles together absolutely everything of value they own—from the cash in the register and the inventory in the warehouse, to the software patents in the vault and the factories on the ground. | $1.4B | +16.3% | +5.4% |
| Metric | Annual (A vs E) | Annual Surprise | Quarter (A vs E) | Quarter Surprise |
|---|---|---|---|---|
| EPS Surprise | 0.54 vs 0.53 | +2.4% | 0.19 vs 0.48 | -60.4% |
| Revenue Surprise | $1.2B vs $1.2B | +0.6% | $368.4M vs $724.3M | -49.1% |
| Date | Executive | Title | Security | Side | Shares | Price |
|---|---|---|---|---|---|---|
| Aug 31, 2026 | Thompson Douglas W. | officer: Chief Operations Officer | Common Stock | A | 6,500 | $66.52 |
| Aug 13, 2026 | Thomas Amiee Lynn | director | Common Stock | A | 1,821 | — |
| Jul 29, 2026 | Thomas Amiee Lynn | director: | — | — | 0 | — |
| Jun 22, 2026 | Bosserman David | director | Common Stock | A | 1,881 | — |
| Jun 22, 2026 | SHAICH RONALD M | director | Common Stock | A | 1,881 | — |
Operator: Hello, everyone. Thank you for joining us, and welcome to CAVA's Second Quarter 2026 Financial Results Conference Call. [Operator Instructions] I will now hand the conference over to Matt Milanovich, Head of Investor Relations. Matt, please go ahead. Matt Milanovich: Good afternoon, and welcome to CAVA's second quarter 2026 financial results conference call. Before we begin, if you do not already have a copy, the earnings release and related 8-K furnished to the SEC are available on our website at investor.cava.com. The purpose of this conference call is to give investors further details regarding the company's financial results as well as a general update on the company's progress. You will find reconciliations of any non-GAAP financial measure discussed on today's call to the most directly comparable financial measure calculated in accordance with GAAP to the extent available without unreasonable efforts in today's earnings release and supplemental deck, each of which is posted on the company's website. Before we begin, let me remind everyone that this call will contain forward-looking statements. For this purpose, any statements made during this call that are not statements of historical fact may be deemed to be forward-looking statements. Investors should be aware that any forward-looking statements are subject to various risks and uncertainties that could cause actual results to differ materially from those discussed here today. These risk factors are explained in detail in CAVA's most recent annual report on Form 10-K as may be updated by its reports on Form 10-Q and other filings with the SEC. Please refer to these filings for a more detailed discussion of forward-looking statements and the risks and uncertainties of such statements. All forward-looking statements are made as of today, and except as required by law, CAVA undertakes no obligation to publicly update or revise any forward-looking statements, whether as a result of new information, future developments or otherwise. And now I'll turn the call over to the company's Co-Founder and CEO, Brett Schulman. Brett Schulman: Thanks, Matt, and welcome to the call, everyone. Our second quarter results underscore the continued strength of our category-defining brand and the resonance of our value proposition with today's consumer. From Mishawaka, Indiana to Downingtown, Pennsylvania, our newest restaurants continue to outperform our expectations, reinforcing the proven portability of our concept and the growing demand for our differentiated Mediterranean cuisine and welcoming hospitality. This strength, combined with the power of our unit economic model, gives us confidence not only in our momentum today, but in the long runway that lies ahead. Our second quarter financial highlights include a 31.3% increase in CAVA revenue, same restaurant sales of 9%, driven by 5.3% traffic, 17 net new restaurants, ending the quarter with 476 restaurants, a 19.6% increase year-over-year, …
| Name | Title | Compensation | Gender | Year Born | Status |
|---|---|---|---|---|---|
Brett Schulman | Co-Founder, Chief Executive Officer, President & Director | USD 1,859,532 | Male | 1972 | Active |
Douglas W. Thompson | Chief Operations Officer | USD 1,026,269 | Male | 1964 | Active |
Tricia K. Tolivar | Chief Financial Officer | USD 954,482 | Female | 1969 | Active |
Kelly Costanza | Chief People Officer | USD 736,516 | Female | 1976 | Active |
Theodore Xenohristos | Founder, Chief Concept Officer & Director | USD 731,389 | Male | 1979 | Active |
Matt Milanovich | Senior Vice President of Finance | — | Male | — | Active |
Beth McCormick | Chief Technology Officer | — | Female | — | Active |
Joseph J. Kadow | Chief Legal Officer | — | Male | 1957 | Active |
Adam Phillips | Chief Accounting Officer | — | — | — | Active |
Christopher F. Penny | Chief Manufacturing Officer | — | Male | 1967 | Active |
Plus, Trump threatens 50% tariff on automobiles and parts from Canada.
CAVA's 9% Q2 comps growth and 5.3% traffic gain highlight resilient demand, while food-safety concerns test near-term sales momentum.

Booking commands a vastly larger revenue base, but CAVA's growth rate tells a starkly different story over the past eight quarters.
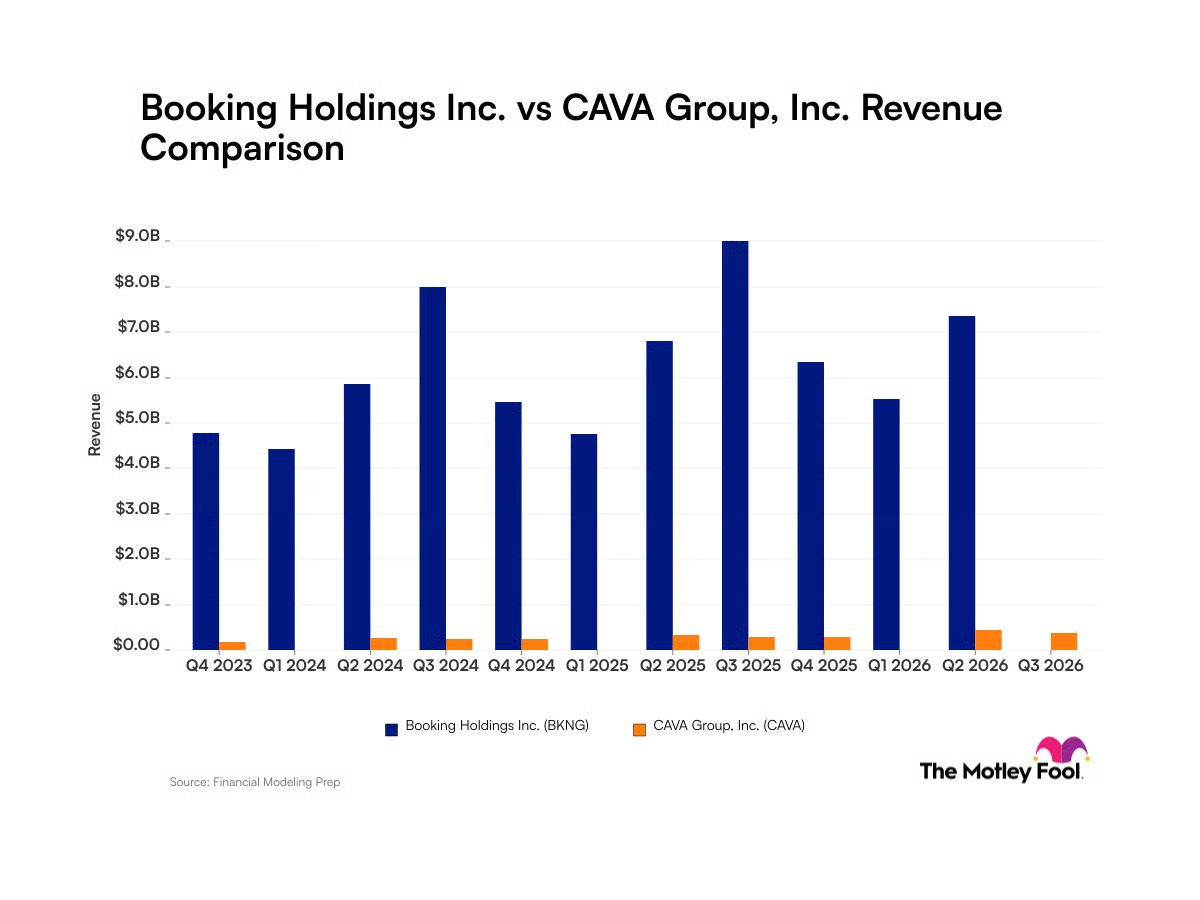
Cava (CAVA -3.91%) is still in its early expansion phase.

CAVA Group Inc. (NYSE: CAVA) shareholders should email fletcher@fmoorelaw.com NEW YORK, Aug. 17, 2026 (GLOBE NEWSWIRE) -- What is the Investigation About ? Cava Group founders and board members sold massive quantities of stock while concealing deteriorating business fundamentals.