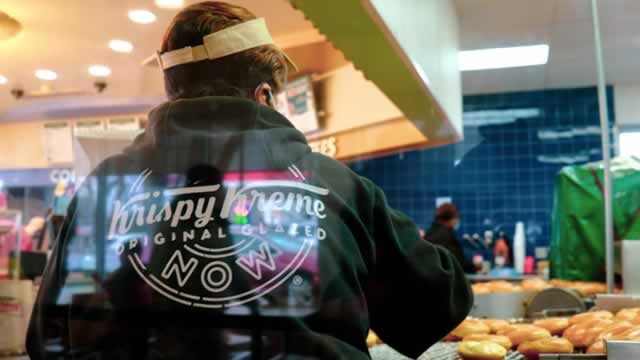
Krispy Kreme, Inc., operating alongside its various subsidiaries, focuses on creating and distributing distinctive doughnut experiences through a comprehensive omni-channel business model. ...
Krispy Kreme, Inc. is an American multinational company specializing in doughnuts, coffee, and other sweet treats. Founded by Vernon Rudolph in 1937 in Winston-Salem, North Carolina, the company has grown into a global brand with operations in approximately 30 countries. Its business is structured into three divisions: U.S. and Canada, ...Krispy Kreme, Inc. is an American multinational company specializing in doughnuts, coffee, and other sweet treats. Founded by Vernon Rudolph in 1937 in Winston-Salem, North Carolina, the company has grown into a global brand with operations in approximately 30 countries. Its business is structured into three divisions: U.S. and Canada, International, and Market Development, ensuring broad geographic reach. The company sells through retail shops, a delivered fresh daily model, e-commerce, and direct delivery, offering a wide range of products including doughnuts, cookies, brownies, ice cream, and beverages. As of early 2022, it operated 1,810 branded outlets (Krispy Kreme and Insomnia Cookies), with a mix of company-owned and franchise locations. Headquartered in Charlotte, North Carolina, Krispy Kreme became publicly traded on NASDAQ in July 2021. The company emphasizes innovation and omni-channel retailing, aiming to deliver joy through its products. Financially, it has shown resilience with a market cap around $575 million, though it faces challenges with negative profitability margins and high debt levels. Key executives include CEO Joshua Charlesworth, leading the company's strategic growth. The brand is deeply embedded in American culture, known for its 'Hot Now' signs and charitable initiatives.
YoYYoY means Year-over-Year. It compares the latest annual value with the previous annual value to show long-term trend strength.
QoQQoQ means Quarter-over-Quarter. It compares the latest quarter with the immediately previous quarter to show short-term momentum changes.
RevenueThe total money that came through the front door from selling things, before paying a single bill. Think of it as the grand total of every credit card swipe from customers. (YoY compares this year to last year's performance, while QoQ compares the current three months to the previous three).
$1.5B
-8.6%
-9.8%
Net IncomeThe absolute bottom line. If the company paid every single supplier, employee, banker, and tax collector, this is the actual money left in their pocket at the end of the day.
$-515.8M
-16764.5%
+27.9%
Gross MarginThe basic markup. If they sell a $100 pair of sneakers, this percentage tells you how much of that price tag is profit right after paying for the rubber and shoelaces, but before paying for things like store rent or TV commercials.
+14.1%
-81.4%
+364.5%
Operating MarginThe 'day job' efficiency score. Out of every dollar a customer spends, this shows how many cents the company keeps after making the product AND paying for all the everyday corporate overhead (like salaries, marketing, and keeping the lights on).
-2.2%
-316.6%
-21.3%
Net MarginThe final take-home percentage. When you strip away every conceivable cost, tax, and interest payment, this is the exact number of cents the company truly gets to keep from every dollar in sales.
-33.9%
-18327.2%
+20.1%
Free Cash FlowThe holy grail of corporate cash. It's the spendable, physical money left over after the business pays for its daily operations AND buys the big, expensive upgrades (like new factories or servers) it needs to survive. This is the 'free' money they can use to pay dividends or buy back stock.
$-64.0M
+14.6%
-253.9%
FCF MarginThe ultimate cash conversion rate. It shows how good the company is at turning regular sales directly into cold, hard, spendable cash. A high percentage means the business is an absolute cash-printing machine.
-4.2%
+6.6%
-270.7%
Debt / EquityThe financial risk gauge. It compares how much of the company's empire was built using borrowed money (loans) versus the owners' own money (shareholders). A high number means they are heavily leveraged and playing a riskier game; a low number means they are playing it safe.
217.1%
+82.1%
+7.8%
Current RatioThe 12-month survival check. It simply compares the cash they have right now (plus things they can quickly turn into cash) against the immediate bills they absolutely must pay this year. A score above 1 means they have enough in the wallet to cover the upcoming bills without panicking.
0.38x
+7.2%
-15.1%
Total AssetsThe absolute size of the company's empire. It bundles together absolutely everything of value they own—from the cash in the register and the inventory in the warehouse, to the software patents in the vault and the factories on the ground.
Operator: Hello everyone, and thank you for standing by. My name is Paige, and I will be your conference operator today. At this time, I would like to welcome everyone to the Krispy Kreme Second Quarter 2026 Earnings Call. [Operator Instructions] I would now like to turn the call over to Steve West, Krispy Kreme Vice President of Investor Relations. Steve, please go ahead.
Steve West: Good morning, everyone, and welcome to Krispy Kreme's second quarter 2026 earnings call. Joining me are President and Chief Executive Officer Josh Charlesworth and Chief Financial Officer Raphael Duvivier. The second quarter earnings release and accompanying presentation are available on our Investor Relations website at investors.krispykreme.com. This call will also be available on our website and contains forward-looking statements. Forward-looking statements, including those of expectations, future events, or financial performance, are based on current expectations and are subject to risks and uncertainties. Actual events or results could differ materially from those forward-looking statements due to factors described in the cautionary statements in our earnings release, annual report on Form 10-K filed with the SEC, and in other SEC filings we make from time to time. We assume no obligation to update any forward-looking statement, except as may be required by law. Additionally, we will reference certain non-GAAP financial measures. Information about these non-GAAP measures and reconciliations to the closest comparable GAAP measures is available in our earnings release. Any reference to percentage growth when discussing second quarter results is a comparison to the second quarter of 2025, unless otherwise indicated. I will now turn the call over to Josh.
Joshua Charlesworth: Thank you, Steve, and good morning, everyone. The second quarter highlighted continued significant progress on our turnaround to strengthen the balance sheet, reduce leverage, and drive sustainable, profitable growth. Our year-to-date results demonstrate the success of the actions we are taking to grow the business and improve profitability. We remain confident in our ability to deliver our 2026 financial targets and are maintaining our previously issued guidance. Krispy Kreme remains a compelling global growth story, supported by increasing consumer demand for our iconic fresh doughnuts, even in a dynamic macro environment. Unlocking that demand remains our priority, and we are doing so through our 2 largest opportunities: profitable U.S. expansion and capital-light international franchise growth. In the second quarter, demand for our fresh, iconic doughnuts across the U.S. and international markets drove system-wide sales growth of 2.6%, excluding the impact of the now-ended McDonald's USA partnership from last year. Overall, our goal remains to deliver system-wide sales of more than $2 billion in 2026. Adjusted EBITDA margin significantly increased by 340 basis points as our focus on …