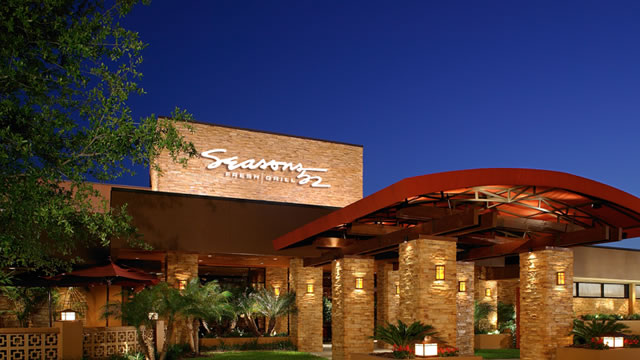
Darden Restaurants, Inc., through its various subsidiaries, focuses on the ownership and operation of full-service dining establishments across both the United States ...
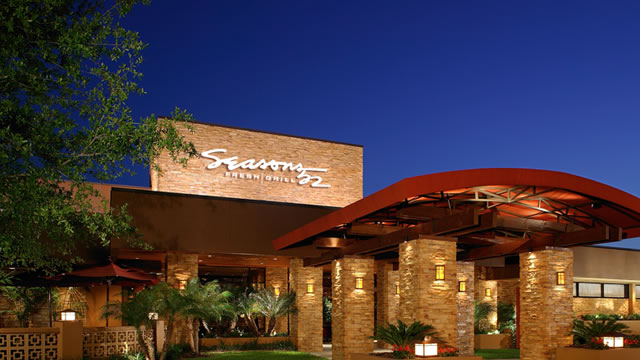
Darden Restaurants, Inc. is the world's largest full-service restaurant company, with a rich history dating back to 1938 when founder Bill Darden opened his first restaurant, The Green Frog. The company was incorporated as a separate public entity in 1995 as a spin-off from General Mills. Today, Darden owns and ...Darden Restaurants, Inc. is the world's largest full-service restaurant company, with a rich history dating back to 1938 when founder Bill Darden opened his first restaurant, The Green Frog. The company was incorporated as a separate public entity in 1995 as a spin-off from General Mills. Today, Darden owns and operates more than 2,200 restaurants under nine distinct brands, each catering to different dining segments. The flagship brand, Olive Garden, is a leading Italian casual dining chain with over 880 locations, generating a significant portion of the company's revenue. LongHorn Steakhouse, with over 540 locations, offers a western-themed steakhouse experience. Other brands include Cheddar's Scratch Kitchen, a casual dining chain known for scratch-made comfort food; Yard House, a high-energy gastropub with an extensive draft beer selection; The Capital Grille, an upscale steakhouse; Seasons 52, a fresh and seasonal grill and wine bar; Bahama Breeze, a Caribbean-themed island grill; Eddie V's Prime Seafood, a fine-dining seafood and steak restaurant; and Capital Burger, a gourmet burger concept. Darden has a strategy focused on operational excellence, guest satisfaction, and innovation. The company generates annual revenue exceeding $11 billion, with a net income margin around 9%. Its financial performance demonstrates strong profitability, with a return on equity of over 50% and a consistent dividend payout. Darden's commitment to growth includes new restaurant openings, brand development, and digital initiatives. Led by CEO Rick Cardenas, a 35-year veteran of the company, Darden's leadership emphasizes a culture of 'Combining a passion for food with a dedication to service.' The company also prioritizes corporate social responsibility, focusing on sustainability, community involvement, and diversity and inclusion. Despite challenges in the restaurant industry, Darden has shown resilience and adaptability, leveraging its scale, brand strength, and efficient operations to deliver value to shareholders and memorable experiences to guests.
YoYYoY means Year-over-Year. It compares the latest annual value with the previous annual value to show long-term trend strength.
QoQQoQ means Quarter-over-Quarter. It compares the latest quarter with the immediately previous quarter to show short-term momentum changes.
RevenueThe total money that came through the front door from selling things, before paying a single bill. Think of it as the grand total of every credit card swipe from customers. (YoY compares this year to last year's performance, while QoQ compares the current three months to the previous three).
$13.2B
+9.4%
+11.2%
Net IncomeThe absolute bottom line. If the company paid every single supplier, employee, banker, and tax collector, this is the actual money left in their pocket at the end of the day.
$1.2B
+15.0%
+32.0%
Gross MarginThe basic markup. If they sell a $100 pair of sneakers, this percentage tells you how much of that price tag is profit right after paying for the rubber and shoelaces, but before paying for things like store rent or TV commercials.
+69.4%
+217.3%
+545.9%
Operating MarginThe 'day job' efficiency score. Out of every dollar a customer spends, this shows how many cents the company keeps after making the product AND paying for all the everyday corporate overhead (like salaries, marketing, and keeping the lights on).
+12.0%
+6.2%
-1.3%
Net MarginThe final take-home percentage. When you strip away every conceivable cost, tax, and interest payment, this is the exact number of cents the company truly gets to keep from every dollar in sales.
+9.1%
+5.1%
+18.7%
Free Cash FlowThe holy grail of corporate cash. It's the spendable, physical money left over after the business pays for its daily operations AND buys the big, expensive upgrades (like new factories or servers) it needs to survive. This is the 'free' money they can use to pay dividends or buy back stock.
$1.1B
+8.1%
-126.0%
FCF MarginThe ultimate cash conversion rate. It shows how good the company is at turning regular sales directly into cold, hard, spendable cash. A high percentage means the business is an absolute cash-printing machine.
+8.5%
-1.2%
-123.4%
Debt / EquityThe financial risk gauge. It compares how much of the company's empire was built using borrowed money (loans) versus the owners' own money (shareholders). A high number means they are heavily leveraged and playing a riskier game; a low number means they are playing it safe.
274.2%
+1.7%
-6.7%
Current RatioThe 12-month survival check. It simply compares the cash they have right now (plus things they can quickly turn into cash) against the immediate bills they absolutely must pay this year. A score above 1 means they have enough in the wallet to cover the upcoming bills without panicking.
0.31x
-24.8%
-19.7%
Total AssetsThe absolute size of the company's empire. It bundles together absolutely everything of value they own—from the cash in the register and the inventory in the warehouse, to the software patents in the vault and the factories on the ground.
Operator: Greetings. Welcome to the Darden Fiscal Year 2026 fourth quarter earnings call. Your line has been placed in a listen-only mode until the question and answer session. This conference is being recorded. I will now turn the call over to Ms. Courtney Aquila.
Courtney Aquila: Thank you, Kevin. Good morning. Thank you for participating on today's call. Joining me are Rick Cardenas, Darden's President and CEO, and Raj Vennam, CFO. As a reminder, comments made during this call will include forward-looking statements as defined in the Private Securities Litigation Reform Act of 1995. A supplemental materials presentation containing information shared on today's call is available on the Financials tab in the Investors section of our website at darden.com. Today's discussion includes certain non-GAAP measurements and reconciliations are included in the presentation. We plan to release Fiscal 2027 first quarter earnings on Thursday, September 24th before the market opens, followed by a conference call. During today's call, all references to industry results refer to the Black Box Intelligence Casual Dining Benchmark, excluding Darden. Black Box Intelligence updated its benchmarks in early May following changes to the underlying brand set, moving average benchmarks up by 150 basis points for same restaurant sales and 25 basis points for same restaurant guest counts. Incorporating this restatement, average same restaurant sales for the industry increased 1.4%, and average same restaurant guest counts decreased 1.8% during our fourth quarter. I will now turn the call over to Rick.
Rick Cardenas: Thank you, Courtney. Good morning, everyone. The fourth quarter was a strong finish to an excellent year, one in which we significantly outperformed the industry. Our restaurant teams continued to execute at a high level, and their commitment to operational excellence helped each of our brands deliver positive same restaurant sales for the quarter. Several of our brands enjoyed record performance on Mother's Day, including the highest-ever traffic day at Olive Garden and LongHorn Steakhouse, and our guest satisfaction results continued to be at or near all-time highs. It was an especially strong year for our three largest brands. Olive Garden met our heightened expectations for the year, delivering 4% same restaurant sales growth, which is above the high end of Darden's long-term framework. LongHorn delivered same restaurant sales growth of over 7% for the year, reflecting their focus on food quality and execution. They ended the year by conducting their ninth annual Steak Master Series — congratulations to Jesse Montalva from the LongHorn Steakhouse in Riverview, Florida, who claimed the championship trophy. Yard House grew total sales by $95 million compared to last year, driven in part by same restaurant sales growth of 5.6% for the year. This marks the fifth consecutive year that all three brands have delivered positive same restaurant sales. We …