
Zacks Investment Research8/6/2026Neutral
5 Quality Stocks Set to Reward Investors With Dividend Hikes
Recent dividend hikes from DRH, STE, BCC, KWR and WHD highlight financially solid companies as investors seek stability in a mixed market.
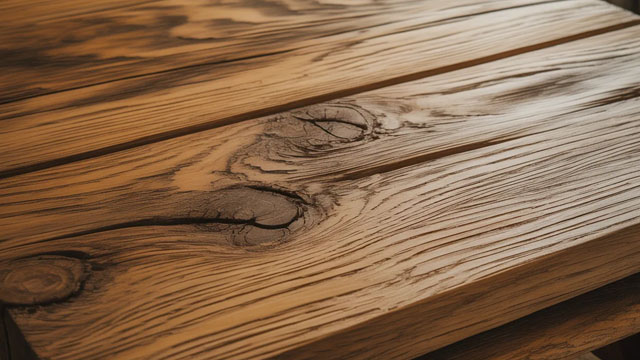
Boise Cascade Company (BCC) is a prominent producer of timber goods and a distributor of construction supplies, operating across both the United ...
Plutux is not an investment adviser. Market data and AI-generated analysis are for information and education only, not investment advice. Disclaimer
$0.88 per share
Est. EPS $1.14 · Revenue $1.76B · 3 analysts
Est. EPS $0.67 · Revenue $1.53B · 6 analysts
Est. EPS $3.92 · Revenue $6.62B · 5 analysts
$0.88 per share
| Metric | Latest | YoYYoY means Year-over-Year. It compares the latest annual value with the previous annual value to show long-term trend strength. | QoQQoQ means Quarter-over-Quarter. It compares the latest quarter with the immediately previous quarter to show short-term momentum changes. |
|---|---|---|---|
| RevenueThe total money that came through the front door from selling things, before paying a single bill. Think of it as the grand total of every credit card swipe from customers. (YoY compares this year to last year's performance, while QoQ compares the current three months to the previous three). | $6.4B | -4.8% | +22.2% |
| Net IncomeThe absolute bottom line. If the company paid every single supplier, employee, banker, and tax collector, this is the actual money left in their pocket at the end of the day. | $132.8M | -64.7% | +221.4% |
| Gross MarginThe basic markup. If they sell a $100 pair of sneakers, this percentage tells you how much of that price tag is profit right after paying for the rubber and shoelaces, but before paying for things like store rent or TV commercials. | +14.0% | -29.3% | +10.2% |
| Operating MarginThe 'day job' efficiency score. Out of every dollar a customer spends, this shows how many cents the company keeps after making the product AND paying for all the everyday corporate overhead (like salaries, marketing, and keeping the lights on). | +2.8% | -61.5% | +147.3% |
| Net MarginThe final take-home percentage. When you strip away every conceivable cost, tax, and interest payment, this is the exact number of cents the company truly gets to keep from every dollar in sales. | +2.1% | -62.9% | +163.0% |
| Free Cash FlowThe holy grail of corporate cash. It's the spendable, physical money left over after the business pays for its daily operations AND buys the big, expensive upgrades (like new factories or servers) it needs to survive. This is the 'free' money they can use to pay dividends or buy back stock. | $12.7M | -93.9% | +133.7% |
| FCF MarginThe ultimate cash conversion rate. It shows how good the company is at turning regular sales directly into cold, hard, spendable cash. A high percentage means the business is an absolute cash-printing machine. | +0.2% | -93.6% | +127.6% |
| Debt / EquityThe financial risk gauge. It compares how much of the company's empire was built using borrowed money (loans) versus the owners' own money (shareholders). A high number means they are heavily leveraged and playing a riskier game; a low number means they are playing it safe. | 25.2% | +4.9% | -3.2% |
| Current RatioThe 12-month survival check. It simply compares the cash they have right now (plus things they can quickly turn into cash) against the immediate bills they absolutely must pay this year. A score above 1 means they have enough in the wallet to cover the upcoming bills without panicking. | 3.36x | +0.3% | -2.0% |
| Total AssetsThe absolute size of the company's empire. It bundles together absolutely everything of value they own—from the cash in the register and the inventory in the warehouse, to the software patents in the vault and the factories on the ground. | $3.2B | -3.8% | +1.4% |
| Metric | Annual (A vs E) | Annual Surprise | Quarter (A vs E) | Quarter Surprise |
|---|---|---|---|---|
| EPS Surprise | 3.52 vs 3.40 | +3.4% | 1.63 vs 1.23 | +32.1% |
| Revenue Surprise | $6.4B vs $6.4B | +0.1% | $1.8B vs $1.8B | +3.4% |
| Date | Executive | Title | Security | Side | Shares | Price |
|---|---|---|---|---|---|---|
| Aug 27, 2026 | Twedt Jill | officer: SVP General Counsel & Corp Sec | Common Stock, par value $0.01 | D | 1,250 | $79.40 |
| Aug 5, 2026 | MATULA KRISTOPHER J | director | Common Stock, par value $0.01 | D | 1,930 | $84.58 |
| May 13, 2026 | Twedt Jill | officer: SVP General Counsel & Corp Sec | Common Stock, par value $0.01 | D | 6,070 | $66.45 |
| Apr 30, 2026 | Jorgensen Nate | director | Common Stock, par value $0.01 | A | 252 | — |
| Mar 3, 2026 | Jorgensen Nate | director, officer: CEO | Common Stock, par value $0.01 | A | 1,813 | — |
Operator: Good morning. My name is Dave, and I will be your conference facilitator today. At this time, I would like to welcome everyone to the Boise Cascade's Second Quarter 2026 Earnings Conference Call. [Operator Instructions] Please note this event is being recorded. I would now like to turn the conference over to Chris Forrey, Senior Vice President, Finance and Investor Relations. Mr. Forrey, you may begin your conference. Chris Forrey: Good morning, everyone. I would like to welcome you to Boise Cascade's Second Quarter 2026 Earnings Call and Business Update. Joining me on today's call are Jeff Strom, our CEO; Kelly Hibbs, our CFO; Jo Barney, leader of our Building Materials Distribution operations; and Troy Little, leader of our Wood Products Operations. Turning to Slide 2. This call will contain forward-looking statements. Please review the warning statements in our press release, on the presentation slides and in our filings with the SEC regarding the risks associated with these forward-looking statements. Also, please note that the appendix includes reconciliations from our GAAP net income to EBITDA and adjusted EBITDA and segment income to segment EBITDA. I will now turn the call over to Jeff. Jeff Strom: Thanks, Chris. Good morning, everyone, and thank you for joining us for our earnings call. I'm on Slide 3. In the second quarter, total U.S. housing starts and single-family housing starts decreased 1% and 4%, respectively, compared to prior year quarter. Our consolidated second quarter sales increased 5% year-over-year to $1.8 billion. Our net income and earnings per share were $57.3 million and $1.63 per share, both higher than the prior year quarter when excluding gains on asset sales reflected in prior year results. I'm pleased with the outstanding results we were able to deliver despite continued demand uncertainty resulting from geopolitical events and volatile mortgage rates. The challenges of consumer sentiment and home affordability remain the most significant headwinds for residential construction activity. In this environment, we're continuing to leverage our integrated model, which consistently demonstrates its value and resilience. Moving to Slide 4. Yesterday, we made the exciting announcement that we're expanding our distribution partnership with James Hardie across a complete portfolio of industry-leading products. including Hardie Siding and Trim, AZEK Exteriors and TimberTech Decking and Railing. As part of the agreement, James Hardie will consolidate its distribution network across all regional markets and has designated Boise Cascade as a sole nationwide distribution partner. We will transition away from distributing competing siding and PVC trim products and bring in James Hardie's full suite of products nationwide. As the sole nationwide distributor, Boise Cascade will be uniquely positioned to provide our customers with a simpler purchasing experience, deeper engagement and support and greater access to James …
| Name | Title | Compensation | Gender | Year Born | Status |
|---|---|---|---|---|---|
Jeffrey Robert Strom | Chief Executive Officer & Director | USD 1,065,347 | Male | 1968 | Active |
Jill Twedt | Senior Vice President, General Counsel & Corporate Secretary | USD 936,050 | Female | 1980 | Active |
Kelly E. Hibbs | Senior Vice President, Chief Financial Officer, Principal Financial & Accounting Officer and Treasurer | USD 927,846 | Male | 1966 | Active |
Joanna Barney | Executive Vice President, Building Materials Distribution | USD 822,580 | Female | 1974 | Active |
Troy Little | Executive Vice President of Wood Products | USD 689,265 | Male | 1968 | Active |
Nathan Sikes | Senior Vice President of Building Materials Distribution, Western Operations | — | Male | 1981 | Active |
Rob Johnson | Senior Vice President of Manufacturing for Wood Products Division | — | Male | 1965 | Active |
Chris Forrey | Senior Vice President of Finance & Investor Relations | — | Male | 1976 | Active |
Jim R. Wickham | Senior Vice President of Building Materials Distribution & Eastern Operations | — | Male | 1966 | Active |
Angella Broesch | Senior Vice President of Human Resources | — | Female | 1977 | Active |
Recent dividend hikes from DRH, STE, BCC, KWR and WHD highlight financially solid companies as investors seek stability in a mixed market.
Stocks with low P/S ratios, solid fundamentals and revenue potential offer opportunities amid improving business momentum. M, PEB, BCC, APLE and PBF are attractively valued.
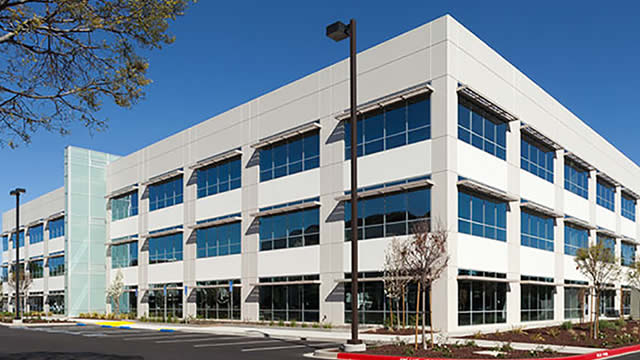
The Zacks Style Scores offers investors a way to easily find top-rated stocks based on their investing style. Here's why you should take advantage.

Boise Cascade NYSE: BCC reported higher second-quarter sales and Wood Products earnings as plywood prices and volumes improved, while the company outlined a broad distribution expansion with James Hardie that it expects will create near-term transition costs but support longer-term growth.

Boise Cascade Company (BCC) Q2 2026 Earnings Call Transcript