Zacks Investment Research6 days agoNeutral
Carlisle (CSL) Down 2.5% Since Last Earnings Report: Can It Rebound?
Carlisle (CSL) reported earnings 30 days ago. What's next for the stock?

Carlisle Companies Incorporated operates as a manufacturer and supplier of building envelope products and solutions in the United States, Europe, North America, ...
Plutux is not an investment adviser. Market data and AI-generated analysis are for information and education only, not investment advice. Disclaimer
Est. EPS $5.90 · Revenue $1.43B · 8 analysts
Est. EPS $4.55 · Revenue $1.22B · 7 analysts
Est. EPS $21.05 · Revenue $5.27B · 7 analysts
Est. EPS $4.15 · Revenue $1.13B · 2 analysts
$4.40 per share
$4.40 per share
| Metric | Latest | YoYYoY means Year-over-Year. It compares the latest annual value with the previous annual value to show long-term trend strength. | QoQQoQ means Quarter-over-Quarter. It compares the latest quarter with the immediately previous quarter to show short-term momentum changes. |
|---|---|---|---|
| RevenueThe total money that came through the front door from selling things, before paying a single bill. Think of it as the grand total of every credit card swipe from customers. (YoY compares this year to last year's performance, while QoQ compares the current three months to the previous three). | $5.0B | +0.3% | +49.3% |
| Net IncomeThe absolute bottom line. If the company paid every single supplier, employee, banker, and tax collector, this is the actual money left in their pocket at the end of the day. | $740.7M | -43.5% | +99.8% |
| Gross MarginThe basic markup. If they sell a $100 pair of sneakers, this percentage tells you how much of that price tag is profit right after paying for the rubber and shoelaces, but before paying for things like store rent or TV commercials. | +35.7% | -5.3% | +4.9% |
| Operating MarginThe 'day job' efficiency score. Out of every dollar a customer spends, this shows how many cents the company keeps after making the product AND paying for all the everyday corporate overhead (like salaries, marketing, and keeping the lights on). | +19.9% | -12.8% | +31.0% |
| Net MarginThe final take-home percentage. When you strip away every conceivable cost, tax, and interest payment, this is the exact number of cents the company truly gets to keep from every dollar in sales. | +14.8% | -43.7% | +33.9% |
| Free Cash FlowThe holy grail of corporate cash. It's the spendable, physical money left over after the business pays for its daily operations AND buys the big, expensive upgrades (like new factories or servers) it needs to survive. This is the 'free' money they can use to pay dividends or buy back stock. | $970.6M | +2.6% | +374.1% |
| FCF MarginThe ultimate cash conversion rate. It shows how good the company is at turning regular sales directly into cold, hard, spendable cash. A high percentage means the business is an absolute cash-printing machine. | +19.3% | +2.3% | +283.7% |
| Debt / EquityThe financial risk gauge. It compares how much of the company's empire was built using borrowed money (loans) versus the owners' own money (shareholders). A high number means they are heavily leveraged and playing a riskier game; a low number means they are playing it safe. | 160.5% | +98.6% | +2.1% |
| Current RatioThe 12-month survival check. It simply compares the cash they have right now (plus things they can quickly turn into cash) against the immediate bills they absolutely must pay this year. A score above 1 means they have enough in the wallet to cover the upcoming bills without panicking. | 3.09x | +7.0% | -23.1% |
| Total AssetsThe absolute size of the company's empire. It bundles together absolutely everything of value they own—from the cash in the register and the inventory in the warehouse, to the software patents in the vault and the factories on the ground. | $6.3B | +7.7% | +4.1% |
| Metric | Annual (A vs E) | Annual Surprise | Quarter (A vs E) | Quarter Surprise |
|---|---|---|---|---|
| EPS Surprise | 17.12 vs 19.09 | -10.3% | 6.27 vs 5.90 | +6.2% |
| Revenue Surprise | $5.0B vs $5.0B | +0.4% | $1.6B vs $1.4B | +9.9% |
| Date | Executive | Title | Security | Side | Shares | Price |
|---|---|---|---|---|---|---|
| Sep 1, 2026 | Frias James D | director | Restricted Stock Units | A | 32 | — |
| Sep 1, 2026 | Hansen Maia | director | Restriced Stock Units | A | 1 | — |
| Sep 1, 2026 | Ricard Corrine D. | director | Restricted Stock Units | A | 26 | — |
| Sep 1, 2026 | Singh Jesse G | director | Restriced Stock Units | A | 16 | — |
| Sep 1, 2026 | Singh Jesse G | director | Deferred Stock Units | A | 13 | — |
Operator: Good afternoon. My name is Rebecca, and I will be your conference call operator today. At this time, I would like to welcome everyone to the Carlisle Companies Second Quarter 26 Earnings Conference Call. All lines have been placed on mute to prevent any background noise. After the speakers' remarks, we will conduct a question and answer session. I will now hand the conference over to Mr. Mehul Patel, Carlisle's vice president of investor relations. Mehul, please go ahead. Mehul Patel: Second quarter 26 earnings call. I am Mehul Patel, vice president of investor relations We released our second quarter financial results earlier today, and you can find both our press release and a presentation for today's call on the Investor Relations section of our website. Joining me today are Christopher Koch, our board chair, president, and CEO and Kevin Zdimal, our CFO. Today's call will begin with Kevin, who will walk through our Q2 financial performance and updated full year 2026 outlook. Christopher will then follow with closing remarks and an overview of our long term value creation strategy. Following our prepared remarks, we will open up the line for questions. Before we begin, please refer to slide 2 where we note that today's comments will include forward looking statements based on current expectations. Actual results could differ materially due to a number of risks and uncertainties which are discussed in our press release and SEC filings. As Carlisle provides non GAAP financial information, we have included reconciliations between GAAP and non GAAP measures in our press release in the appendix of our presentation materials, both of which are available on our website. With that, I will turn the call over to Kevin Zdimal on slide 3. Kevin Zdimal: Thank you, Mehul, and good afternoon, everyone. I will review our second quarter results and discuss our updated outlook for the full year. Let's begin on slide 3. Our record second quarter results reflect the Carlisle team's relentless focus on execution and operational discipline. Continuing our track record of delivering results through challenging macro environments. Revenue was a record $1.6 billion. Increasing 8% year over year, and adjusted EPS increased 12%. to a record $7.03. These results demonstrate our unwavering commitment to operational excellence. Through disciplined pricing, productivity from the Carlisle operating system, and strong commercial execution, we delivered solid growth and profitability. Despite a significant increase in petroleum based raw materials and freight costs stemming from the conflict in The Middle East and related supply chain disruptions. Inflation and several supplier force majeure events impacted key inputs across our roofing and insulation product lines. Our response was timely and commensurate with the cost pressure we expect in the coming months. Since the start of the conflict, we have announced 3 broad based price increases and implemented freight …
| Name | Title | Compensation | Gender | Year Born | Status |
|---|---|---|---|---|---|
D. Christian Koch | Chairman, President & Chief Executive Officer | USD 1,967,825 | Male | 1965 | Active |
Kevin Zdimal | Vice President & Chief Financial Officer | USD 874,970 | Male | 1970 | Active |
Frank J. Ready | President of Carlisle Weatherproofing Technologies | USD 778,127 | Male | 1962 | Active |
David W. Smith | Vice President of Sustainability & Community Relations | — | Male | 1963 | Active |
Christopher Burke Gaskill | Vice President & General Counsel | — | Male | 1982 | Active |
Susan Wallace | Vice President & Chief Human Resources Officer | — | Female | 1965 | Active |
Kelly Kamienski | Vice President of Finance of Carlisle Weatherproofing Technologies | — | Female | 1983 | Active |
Andrew Easton | Vice President & Chief Accounting Officer | — | Male | 1987 | Active |
Mehul Patel | Vice President of Investor Relations | — | Male | 1979 | Active |
Stephen Aldrich | Chief Financial Officer for Carlisle Construction Materials | — | Male | 1981 | Active |
Carlisle (CSL) reported earnings 30 days ago. What's next for the stock?
CSL is riding strong roofing demand, acquisitions and shareholder returns, but rising raw-material and freight costs are testing margins in 2026.
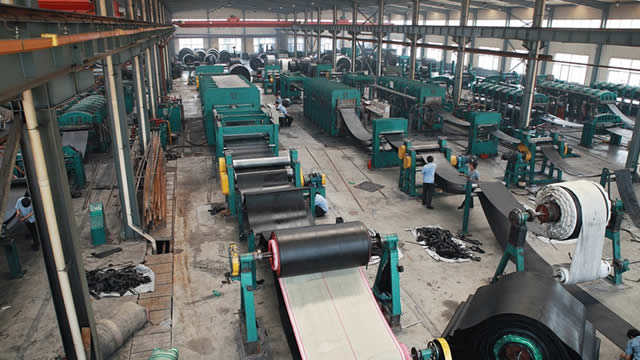
MMM's industrial and transportation strength supports growth, while CSL gains from construction demand but faces rising costs and high debt.

Wall Street is making bold moves Tuesday, upgrading AMD and shaking up fintech names like Klarna and Shift4 while fresh initiations hit Fortune Brands and Jersey Mike's. Find out which stocks analysts are backing and which they are walking away from.

Carlisle Companies is upgraded to Buy after strong Q2 2026 results and improved valuation, with shares now ~19% undervalued. Q2 revenue grew 8% YoY to $1.57B and normalized EPS rose 12% to $7.03, despite margin compression from higher input costs. CSL raised its FY26 share repurchase target to $1.2B and achieved Dividend King status with a 14% dividend hike, marking 50 consecutive increases.