Zacks Investment Research8/7/2026Neutral
Bear of the Day: Builders FirstSource (BLDR)
There is no housing recovery in 2026.
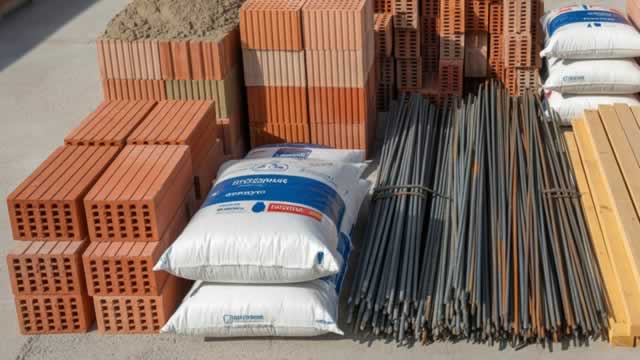
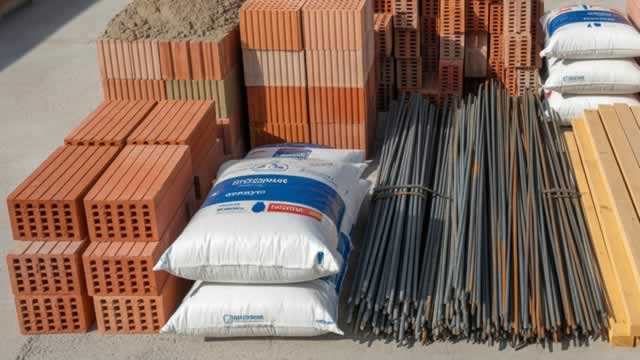
Builders FirstSource, Inc. engages in the supply and manufacture of building materials, manufactured components, and construction services to professional homebuilders, sub-contractors, remodelers, ...
Plutux is not an investment adviser. Market data and AI-generated analysis are for information and education only, not investment advice. Disclaimer
Est. EPS $1.08 · Revenue $3.77B · 13 analysts
Est. EPS $0.60 · Revenue $3.43B · 11 analysts
Est. EPS $3.11 · Revenue $14.34B · 9 analysts
Est. EPS $0.45 · Revenue $3.37B · 4 analysts
| Metric | Latest | YoYYoY means Year-over-Year. It compares the latest annual value with the previous annual value to show long-term trend strength. | QoQQoQ means Quarter-over-Quarter. It compares the latest quarter with the immediately previous quarter to show short-term momentum changes. |
|---|---|---|---|
| RevenueThe total money that came through the front door from selling things, before paying a single bill. Think of it as the grand total of every credit card swipe from customers. (YoY compares this year to last year's performance, while QoQ compares the current three months to the previous three). | $15.2B | -7.4% | +17.5% |
| Net IncomeThe absolute bottom line. If the company paid every single supplier, employee, banker, and tax collector, this is the actual money left in their pocket at the end of the day. | $435.2M | -59.6% | +91.8% |
| Gross MarginThe basic markup. If they sell a $100 pair of sneakers, this percentage tells you how much of that price tag is profit right after paying for the rubber and shoelaces, but before paying for things like store rent or TV commercials. | +29.0% | -11.6% | -0.4% |
| Operating MarginThe 'day job' efficiency score. Out of every dollar a customer spends, this shows how many cents the company keeps after making the product AND paying for all the everyday corporate overhead (like salaries, marketing, and keeping the lights on). | +5.2% | -46.8% | +510.4% |
| Net MarginThe final take-home percentage. When you strip away every conceivable cost, tax, and interest payment, this is the exact number of cents the company truly gets to keep from every dollar in sales. | +2.9% | -56.4% | +93.0% |
| Free Cash FlowThe holy grail of corporate cash. It's the spendable, physical money left over after the business pays for its daily operations AND buys the big, expensive upgrades (like new factories or servers) it needs to survive. This is the 'free' money they can use to pay dividends or buy back stock. | $853.3M | -42.8% | -26.4% |
| FCF MarginThe ultimate cash conversion rate. It shows how good the company is at turning regular sales directly into cold, hard, spendable cash. A high percentage means the business is an absolute cash-printing machine. | +5.6% | -38.3% | -37.3% |
| Debt / EquityThe financial risk gauge. It compares how much of the company's empire was built using borrowed money (loans) versus the owners' own money (shareholders). A high number means they are heavily leveraged and playing a riskier game; a low number means they are playing it safe. | 129.8% | +28.7% | -1.0% |
| Current RatioThe 12-month survival check. It simply compares the cash they have right now (plus things they can quickly turn into cash) against the immediate bills they absolutely must pay this year. A score above 1 means they have enough in the wallet to cover the upcoming bills without panicking. | 1.86x | +5.2% | +1.7% |
| Total AssetsThe absolute size of the company's empire. It bundles together absolutely everything of value they own—from the cash in the register and the inventory in the warehouse, to the software patents in the vault and the factories on the ground. | $11.2B | +6.2% | +0.2% |
| Metric | Annual (A vs E) | Annual Surprise | Quarter (A vs E) | Quarter Surprise |
|---|---|---|---|---|
| EPS Surprise | 3.89 vs 7.05 | -44.8% | -0.04 vs 1.08 | -103.7% |
| Revenue Surprise | $15.2B vs $15.3B | -0.6% | $3.9B vs $3.8B | +2.5% |
| Date | Executive | Title | Security | Side | Shares | Price |
|---|---|---|---|---|---|---|
| Jul 18, 2026 | O'Brien Matthew Coley | officer: Chief Human Resources Officer | Common Stock, par value $0.01 per share | A | 7,406 | — |
| Jul 18, 2026 | Vaughn Paul | officer: President - West Division | Common Stock, par value $0.01 per share | A | 3,366 | — |
| Jul 18, 2026 | Vance Todd | officer: President - East Division | Common Stock, par value $0.01 per share | A | 3,366 | — |
| Jun 13, 2026 | Narayan Gayatri | officer: President - Tech & Digital | Common Stock, par value $0.01 per share | D | 2,842 | $77.77 |
| Jun 5, 2026 | Herron Stephen J | officer: Chief Operating Officer | Common Stock, par value $0.01 per share | D | 850 | — |
Operator: Good day, and welcome to the Builders FirstSource Second Quarter 2026 Earnings Conference Call. Today's call is scheduled to last about 1 hour, including remarks by management and the question-and-answer session. I'd now like to turn the call over to Heather Kos, Senior Vice President, Investor Relations for Builders FirstSource. Please go ahead. Heather Kos: Good morning, and welcome to our second quarter 2026 earnings call. With me on the call are Peter Jackson, our CEO; and Pete Beckmann, our CFO. The earnings press release and presentation are available on our website at investors.bldr.com. We will refer to the presentation during our call. The results discussed today include GAAP and non-GAAP results adjusted for certain items. We provide these non-GAAP results for informational purposes, and they should not be considered in isolation from the most directly comparable GAAP measures. You can find the reconciliation of these non-GAAP measures to the corresponding GAAP measures where applicable and a discussion of why we believe they can be useful to investors in our earnings press release, SEC filings and presentation. Our remarks in the press release, presentation and on this call contain forward-looking and cautionary statements within the meaning of the Private Securities Litigation Reform Act and projections of future results. Please review the forward-looking statements section in today's press release and in our SEC filings for various factors that could cause our actual results to differ from forward-looking statements and projections. With that, I'll turn the call over to Peter. Peter Jackson: Thank you, Heather, and good morning, everyone. Our second quarter results reflect the strength of our differentiated platform and the adaptability of our operating model. We remain focused on the factors within our control including managing the business with discipline and leveraging both our technology capabilities and our value-added solutions. This approach continues to strengthen our position as the partner of choice to homebuilders. While housing market conditions remain weak, we are continuing to invest in innovation and capabilities that enhance the customer experience, improve efficiency across the value chain and reinforce our competitive advantages. Our business model is built to perform through the cycle, and we are confident in our ability to outgrow the market over time and create sustainable long-term value for our shareholders. Now let's turn to Slide 4. Our second quarter performance underscores the resilience of our platform in a challenging housing environment. Sales and adjusted EBITDA were in line with expectations, supported by the strength of our team, our value-added solutions and the discipline embedded in how we run our business. Before turning to our strategic priorities, let me spend a moment on the market backdrop. Ongoing geopolitical uncertainty, persistent inflation, and elevated interest rates …
| Name | Title | Compensation | Gender | Year Born | Status |
|---|---|---|---|---|---|
Peter Jackson | President, Chief Executive Officer & Director | USD 1,560,262 | Male | 1972 | Active |
Gayatri Narayan | President of Technology & Digital Solutions | USD 1,382,745 | Female | 1978 | Active |
Stephen J. Herron | Chief Operating Officer | USD 1,082,722 | Male | 1959 | Active |
Pete Beckmann | Executive Vice President & Chief Financial Officer | USD 952,326 | Male | 1978 | Active |
Michael Hiller | Chief Talent Officer | USD 868,218 | Male | 1974 | Active |
Matthew Coley O'Brien | EVP & Chief Human Resources Officer | — | Male | 1974 | Active |
Jami Beckmann Coulter | Senior Vice President of the Strategic Management Office | — | Female | 1977 | Active |
Alena S. Brenner | Executive VP, Chief Legal Officer & Corporate Secretary | — | Female | 1977 | Active |
Coley O'Brien | EVP & Chief Human Resources Officer | — | Male | — | Active |
Matthew Trester | Vice President, Controller & Principal Accounting Officer | — | Male | — | Active |
Mike McCranie | Chief Information Officer | — | Male | — | Active |
Heather Anne Kos | Senior Vice President of Investor Relations | — | Female | 1971 | Active |
There is no housing recovery in 2026.
Cetera Investment Advisers lowered its stake in Builders FirstSource, Inc. (NYSE: BLDR) by 16.3% in the first quarter, according to the company in its most recent disclosure with the Securities and Exchange Commission (SEC). The institutional investor owned 41,118 shares of the company's stock after selling 8,025 shares during the period. Cetera Investment

Empowered Funds LLC reduced its holdings in Builders FirstSource, Inc. (NYSE: BLDR) by 32.7% during the undefined quarter, according to the company in its most recent Form 13F filing with the Securities and Exchange Commission. The institutional investor owned 37,539 shares of the company's stock after selling 18,218 shares during the period. Empowered

Builders FirstSource cuts its 2026 outlook as softer housing demand, margin pressure and weaker earnings weigh on results despite ongoing cost-saving efforts.

Builders FirstSource trades at a discount, but weaker earnings, lower guidance and higher leverage keep pressure on the outlook despite potential long-term recovery.