%22%2F%3E%0A%20%20%3Ccircle%20cx%3D%22220%22%20cy%3D%22150%22%20r%3D%22180%22%20fill%3D%22%2322d3ee%22%20fill-opacity%3D%220.12%22%2F%3E%0A%20%20%3Ccircle%20cx%3D%221010%22%20cy%3D%22130%22%20r%3D%22220%22%20fill%3D%22%2338bdf8%22%20fill-opacity%3D%220.08%22%2F%3E%0A%20%20%3Ccircle%20cx%3D%22920%22%20cy%3D%22520%22%20r%3D%22170%22%20fill%3D%22%2322d3ee%22%20fill-opacity%3D%220.06%22%2F%3E%0A%20%20%3Cpath%20d%3D%22M140%20430h920%22%20stroke%3D%22url(%23line)%22%20stroke-width%3D%2212%22%20stroke-linecap%3D%22round%22%2F%3E%0A%20%20%3Cpath%20d%3D%22M220%20360c120-150%20260-220%20380-220s260%2070%20380%20220%22%20fill%3D%22none%22%20stroke%3D%22%2367e8f9%22%20stroke-opacity%3D%220.5%22%20stroke-width%3D%2216%22%20stroke-linecap%3D%22round%22%20stroke-linejoin%3D%22round%22%2F%3E%0A%20%20%3Cpath%20d%3D%22M300%20398h600%22%20stroke%3D%22%2394a3b8%22%20stroke-opacity%3D%220.24%22%20stroke-width%3D%228%22%20stroke-linecap%3D%22round%22%2F%3E%0A%20%20%3Ctext%20x%3D%22220%22%20y%3D%22510%22%20fill%3D%22%23e2e8f0%22%20fill-opacity%3D%220.7%22%20font-family%3D%22Arial%2C%20Helvetica%2C%20sans-serif%22%20font-size%3D%2238%22%20letter-spacing%3D%228%22%3EINSIGHTS%3C%2Ftext%3E%0A%3C%2Fsvg%3E)
Schedule risk moved, and margins followed
Why the permit window is no longer the only clock in AI builds
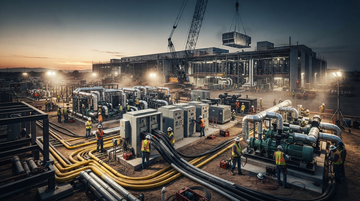
AI data-center timelines used to be framed as a permitting and utility-interconnect story. But as projects progress, the critical path increasingly depends on whether contractors can staff, sequence, and install the electrical and mechanical scope fast enough to hit commissioning dates.
The market signal is straightforward: when the field labor pool is overstretched, the build can’t convert “approved MW” into operating MW. That turns construction capacity into a pricing and margin lever—one that behaves differently from the semiconductor supply chain.
What’s actually constrained
MEP installation capacity is acting like a throughput limiter (not a cost line item)
- Skilled-trade availability is tightening, so projects can slip even when design and approvals are complete.
- Electrical and mechanical scope is highly interdependent: conduits, cable pulls, switchgear, and cooling components need sequencing discipline to avoid rework.
- Because commissioning windows are fixed to grid readiness and downstream equipment arrival, missed install capacity pushes schedule risk into later stages—often with liquidated damages or higher financing costs.
Construction labor availability has moved from a “cost of doing business” to an execution constraint. For investors, the key shift is interpretive: the market increasingly prices the ability to deliver megawatts on schedule, not just the ability to win the engineering contract.
Core build-to-commission bottleneck (the investor checklist)
Upstream signal
Permits/utilities move forward, but staffing and install sequencing determine conversion to on-line MW.
Field constraint
Electrical + mechanical labor availability and contractor capacity to install, test, and coordinate commissioning.
Investor consequence
Working-capital and execution reliability can dominate margin performance when jobsite throughput is tight.
Margin map shift
Why the construction/MEP stack’s margin profile doesn’t rhyme with the chip stack
Semiconductor supply chains are dominated by yields, utilization, and pricing cycles at scale. The construction/MEP layer is dominated by job execution: subcontractor staffing, procurement timing, change-order exposure, and the working-capital loop (billings, retention, and cash conversion).
That means you can see “AI demand” reflected in revenue, while profit can lag or swing depending on labor efficiency and schedule adherence.
MasTec FY2025 revenue
$16.11B
FY2025 (reported Feb 26, 2026) — shows demand converting into top-line
MasTec FY2025 gross profit
$2.08B
FY2025 (reported Feb 26, 2026) — indicates gross profit generation despite execution risk
MasTec FY2025 net income
$399M
FY2025 (reported Feb 26, 2026) — profit depends on execution and project mix
MasTec FY2024 revenue
$12.30B
FY2024 (reported Feb 28, 2025) — revenue scaled faster than profitability did in the intervening period
The point isn’t that every contractor will underperform; it’s that the margin sensitivity is different. In jobsite-heavy businesses, cash conversion and execution cadence can dominate outcomes even when broader AI demand is bullish.
Execution math: capacity → cash
Working-capital intensity becomes an early “schedule health” metric
MasTec revenue growth shows demand—execution quality decides how much profit survives
FY revenue trend (latest annual periods available from company financial statements).
Unit: USD
FY2023
Reported Mar 1, 2024 (FY2023)
11,995,934,000
FY2024
Reported Feb 28, 2025 (FY2024)
12,303,464,000
FY2025
Reported Feb 26, 2026 (FY2025)
14,299,171,000
When jobsite throughput is constrained, cash conversion can worsen even if utilization rises. Reasons include longer cycles to mobilize specialized labor, higher reliance on subcontractors at peak rates, and delays in final acceptance.
For investors, watch for whether contractors convert revenue growth into stable margins and improving cash generation—not just backlog.
What to watch next (short-term)
The next moves in days-to-quarters: who can install, and who can absorb slips
- Schedule slippage tends to show up first in cash conversion timing and retention dynamics, then in margins.
- Look for management commentary on staffing plans for electrical/mechanical crews and subcontractor availability (and whether they’ve locked labor supply early).
- Change orders can reverse margin: when installation capacity is tight, design clarifications and field constraints may increase rework risk.
What to watch next (1–3 years)
The long-term re-rating: execution platforms, not just project wins
Over a 1–3 year horizon, the investment opportunity is less about any single AI campus and more about building an execution platform: repeatable MEP installation capacity, procurement discipline, and the ability to manage commissioning risk.
Engineering and consulting firms that provide energy/grid studies, permitting support, and design review can benefit too—but the field layer is where schedule risk becomes monetizable or destructive.
| Layer | What improves | What can still break | Investor signal to track |
|---|---|---|---|
| Permits/utilities | Start dates and interconnection milestones | Commissioning is still constrained by field install capacity | Approved MW vs. operating MW cadence |
| General contractor + MEP installers | Schedule throughput if staffing and sequencing hold | Margin compression from labor scarcity, rework, and change-order exposure | Gross margin stability and cash conversion |
| Engineering/consulting | Design readiness and permitting quality | Does not fix field labor limitations on installation/commissioning | Backlog mix and utilization of engineering capacity |
Listed ways to express the execution-capacity thesis
- MasTec scaled revenue to $14.30B in FY2025 while profit depends on execution and job mix in constrained MEP install environments.
- Revenue growth outpaces margin stability risk when electrical/mechanical staffing tightens, making cash conversion a leading indicator.
- Dycom earned operating profit in FY(TTM) with margins around the mid-teens, but schedule slips can still reprice risk through change orders.
- Dycom faces subcontractor and craft-trade capacity pressure, so near-term margin volatility can rise with MEP throughput constraints.
- Fluor reported negative margins in the most recent trailing period available, highlighting how execution risk can overwhelm top-line in complex builds.
- If field capacity is scarce, Fluor’s project economics can remain fragile and less resilient than specialty installers.
- Jacobs has large-scale engineering exposure with low trailing margins, so benefits from better design/permitting may be capped by MEP field install bottlenecks.
- Over the next 2–6 quarters, investors should watch for whether cash generation improves as project delivery normalizes.
- Willdan runs with positive trailing net margins (~8.8%), implying an ability to monetize energy/project readiness when constraints rise.
- If permitting/design leads are leveraged to reduce execution surprises, Willdan can capture upside without taking the full jobsite schedule risk.
- Tetra Tech reported positive trailing operating and net margins, supporting a view that specialized engineering services can benefit from AI buildout complexity.
- If water/resource permitting and infrastructure planning face delays, Tetra Tech’s advisory role can scale while installation remains the field bottleneck.