%22%2F%3E%0A%20%20%3Ccircle%20cx%3D%22220%22%20cy%3D%22150%22%20r%3D%22180%22%20fill%3D%22%2322d3ee%22%20fill-opacity%3D%220.12%22%2F%3E%0A%20%20%3Ccircle%20cx%3D%221010%22%20cy%3D%22130%22%20r%3D%22220%22%20fill%3D%22%2338bdf8%22%20fill-opacity%3D%220.08%22%2F%3E%0A%20%20%3Ccircle%20cx%3D%22920%22%20cy%3D%22520%22%20r%3D%22170%22%20fill%3D%22%2322d3ee%22%20fill-opacity%3D%220.06%22%2F%3E%0A%20%20%3Cpath%20d%3D%22M140%20430h920%22%20stroke%3D%22url(%23line)%22%20stroke-width%3D%2212%22%20stroke-linecap%3D%22round%22%2F%3E%0A%20%20%3Cpath%20d%3D%22M220%20360c120-150%20260-220%20380-220s260%2070%20380%20220%22%20fill%3D%22none%22%20stroke%3D%22%2367e8f9%22%20stroke-opacity%3D%220.5%22%20stroke-width%3D%2216%22%20stroke-linecap%3D%22round%22%20stroke-linejoin%3D%22round%22%2F%3E%0A%20%20%3Cpath%20d%3D%22M300%20398h600%22%20stroke%3D%22%2394a3b8%22%20stroke-opacity%3D%220.24%22%20stroke-width%3D%228%22%20stroke-linecap%3D%22round%22%2F%3E%0A%20%20%3Ctext%20x%3D%22220%22%20y%3D%22510%22%20fill%3D%22%23e2e8f0%22%20fill-opacity%3D%220.7%22%20font-family%3D%22Arial%2C%20Helvetica%2C%20sans-serif%22%20font-size%3D%2238%22%20letter-spacing%3D%228%22%3EINSIGHTS%3C%2Ftext%3E%0A%3C%2Fsvg%3E)
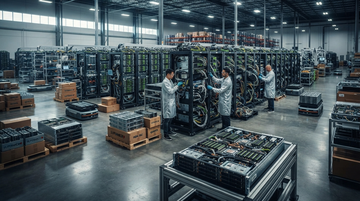
The AI build-out is moving too fast for investors to fully price where value is created. Hyperscalers are buying racks; Nvidia is selling silicon. In between sit ODMs and system integrators that do the hardest operational work—thermals, power, interconnects, validation, supply-chain coordination, and sometimes final assembly close to where the racks land.
The blind spot: investors often track GPU demand and then assume server OEM/ODM economics should follow mechanically. But the margin structure is dominated by what ODMs pay inside cost of sales: component spot inflation, tariffs, logistics/expedite, and the contractual reality that the “hard part” is less about designing the board and more about keeping a multi-vendor stack working at yield. That reality shows up starkly in Supermicro’s SEC gross-margin driver language: costs rise with shipment volume and new trade policies, while gross margin stays in the high-single to low-teens range.
This article maps the full AI-server assembly supply chain and then explains why the ODM layer tends to harvest revenue growth without margin lift, and what that implies for onshoring, gray-market risk, and which listed stocks are most exposed to the margin map.
Thesis: the ODM margin ceiling is downstream of silicon pricing power
From GPUs to racks, most economics get “spent” inside cost of sales
AI-server economics are often modeled as a simple chain: GPU demand → server demand → ODM/OEM revenue. The problem is that margins don’t transfer 1:1 across that chain.
In practical terms, ODMs convert a multi-part GPU and networking stack into a validated, shippable system. Their income statement margin is largely determined by (1) negotiated component pricing and (2) how much of cost shocks (tariffs, expedite, and write-down risk) land in gross profit.
Supermicro provides a clear, investor-readable window into the mechanics. In its SEC filing for the quarter ended Mar 31, 2026, it reported a gross margin of 9.9% while describing cost-of-sales increases tied to higher shipment volume for GPU servers/HPC/rack-scale solutions and tariff expenses from new trade policies. That combination is the pattern investors should expect when the AI build-out speeds up but component/transport friction doesn’t disappear.
Supermicro gross margin (quarter ended Mar 31, 2026)
9.9%
Three months ended Mar 31, 2026, reported in its Form 10-Q filed May 11, 2026
Supermicro gross margin (nine months ended Mar 31, 2026)
8.2%
Nine months ended Mar 31, 2026, reported in its Form 10-Q filed May 11, 2026
Verified anchor + supply-chain map
Where the money gets captured: Nvidia’s silicon pricing vs. ODM’s operational pass-through
To understand the margin map, separate “power” (who sets prices) from “operations” (who absorbs costs).
At the top of the stack, Nvidia has strong pricing power on GPUs and networking silicon. Below that, ODM/system integrators face multi-vendor bill-of-materials, tight delivery windows, and quality/yield constraints—so their margin is sensitive to what happens inside cost of sales, not just to whether demand rises.
Supermicro’s filing gives concrete drivers of cost-of-sales inflation. For the quarter ended Mar 31, 2026, it cited an approximately $5.05B increase in certain products (including GPU servers and rack-scale solutions) tied to higher shipment volume, alongside tariff expense increases due to new trade policies. It also described a gross-margin decrease over the nine-month window in part due to changes in product/customer mix and higher production/expedite costs while it began shipping new AI GPU platforms on a large scale.
| Time window | Gross margin | Cost-of-sales pressure cited in filing | What this means for ODM economics |
|---|---|---|---|
| Three months ended Mar 31, 2026 | 9.9% | Higher shipment volume for GPU servers/HPC/rack-scale solutions plus tariff expense increases from new trade policies | Revenue can rise without margin expansion when tariffs and expedite costs scale with volume |
| Nine months ended Mar 31, 2026 | 8.2% | Product/customer mix shifts plus higher production/expedite costs; tariff expense and inventory write-down adjustments increased | Even when scale improves, cost shocks and write-down risk can keep gross margin low |
A key nuance: ODMs often run “assembly and integration” risk through suppliers and contract manufacturing. In Supermicro’s filing, it names specific related parties/contract manufacturing references as part of cost-of-sales concentration discussion—underscoring that a large portion of cost of sales is not just self-manufactured value-add, but externally purchased components and outsourced manufacturing.
Bridging the gap: why the ODM layer can feel “busy” yet remain low-margin
The hidden margin math investors miss: yield, expedite, and tariff timing
Volume tells only half the story. The ODM layer’s gross profit depends on the timing and magnitude of input-cost shocks.
In Supermicro’s disclosure, the company explicitly links cost-of-sales increases to both (1) shipment volumes for AI GPU-related products and (2) tariff expense from new trade policies. It also cites inventory write-down adjustments in the nine-month window. That is exactly how margin ceilings behave in fast-cycle hardware booms: the operational bottleneck shifts from “can you assemble?” to “can you assemble at a stable landed cost and acceptable write-down risk?”
This is why the market can underestimate the risk of “order acceleration” phases. Investors may interpret revenue growth at ODMs as margin expansion potential; the filing language implies the opposite: cost structure can compress even as units increase.
- Shipping more AI GPU servers increases cost of sales before gross profit catches up, especially when production/expedite requirements scale with volume.
- Tariff expense can scale mechanically with the bill of materials, keeping gross margin capped even when revenue rises.
- Inventory write-down risk increases when new AI GPU platforms ramp at scale and product mix shifts.
Scaling the build-out at major ODMs
The ODM layer is large enough that “single-digit margin” can still fund the entire build-out
Even if the ODM margin is thin, the AI build-out creates enormous dollar throughput across ODMs and component ecosystems.
Using listed-entity financial statements, you can see the scale of revenue at the major Taiwan-centric ODMs mentioned in the topic framing—without needing to assume margin expansion. For example, Hon Hai Precision generated $8.58T TWD of revenue on a trailing-twelve-month basis (TTM through the latest period in the income statement series), while Quanta Computer reported $2.98T TWD of TTM revenue. Wistron and Supermicro provide additional views of how the same AI-server demand wave shows up in revenue scale, but the key investor question remains: will gross margin lift or stay cost-constrained?
Hon Hai Precision revenue (TTM)
8.58T TWD
TTM revenue shown for the latest period in its income statement series (filing date shown by the income statement extract as 2026-03-31)
Quanta Computer revenue (TTM)
2.98T TWD
TTM revenue shown for the latest period in its income statement series (filing date shown by the income statement extract as 2026-06-30)
Supermicro revenue (TTM)
39.1B USD
TTM revenue shown in its income statement series (filing date shown by the income statement extract as 2026-08-11; fiscal year end June)
This is the reason the market can underreact: the ODM layer doesn’t need margin expansion to grow profits at the enterprise level. It only needs (a) stable demand and (b) enough operational control to prevent cost-of-sales shocks from swallowing gross profit.
Onshoring & constraints
Onshoring headlines can boost capacity without fixing the core margin drivers
Onshoring changes the physical footprint of assembly and testing, but it doesn’t automatically remove tariff exposure, expedite requirements, or component lead-time mismatches.
The investor takeaway is not “onshoring is bad.” It’s that the margin map should be evaluated in terms of what it changes in cost of sales. If moving assembly geographically reduces logistics variability and tariff exposure for a given product mix, gross margin can improve. If not, onshoring becomes a capacity story that supports revenue while gross margin remains constrained by input costs.
Gray-market risk & compliance shocks
Gray-market and export-control risk is a second margin headwind (not just an IT/legal problem)
When AI servers depend on controlled components and cross-border sourcing, compliance risks can translate directly into cost and margin outcomes.
Supermicro’s SEC disclosure includes language around an investigation it launched into allegations involving alleged conspiracy to commit export control violations. Even without a quantified fine or financial impact in the disclosure excerpt, investigations can still create cost drag: remediation spending, delayed shipments, customer renegotiations, and supply-chain restrictions. Investors tend to treat these as “headline risks”; the margin-map view treats them as gross-profit risk because they can interrupt the continuity of component availability and assembly timelines.
Practical portfolio lens
How to trade this theme: watch cost-of-sales language, not just AI-server revenue growth
To avoid the blind spot, investors should look for margin-relevant indicators that show up in filings and disclosures:
1) Direct references to tariffs or trade-policy-driven tariff expense. 2) References to production/expedite cost increases. 3) Inventory write-down adjustments during new platform ramps. 4) Concentration disclosures naming key suppliers/contract manufacturers that represent a meaningful share of cost of sales.
Supermicro’s filing provides all four in a single consolidated narrative, which is why it works as a “load-bearing” example for the ODM margin map.
- If filings show tariff and expedite language rising with AI product shipments, expect revenue growth to outpace gross margin.
- If inventory write-down adjustments appear during new platform ramps, discount order growth until gross margin stabilizes.
- If supplier/contract-manufacturer concentration increases, treat it as a supply-risk amplifier that can quickly impact cost of sales.
Listed stocks most directly exposed to the ODM margin map
- Supermicro’s filing shows gross margin stayed at 9.9% in the quarter ended Mar 31, 2026 while AI GPU-server shipments rose, implying cost shocks scaled with volume.
- Supermicro cited tariff expense and production/expedite costs rose in the nine months ended Mar 31, 2026, a direct reason gross margin stayed near 8.2%.
- Over the next 1–2 quarters, investors should watch whether future filings show less tariff/expedite drag before assuming AI revenue converts into higher margins.
- Hon Hai’s trailing-twelve-month revenue reached $8.58T TWD, showing scale supports throughput even when the ODM layer’s margin ceiling limits upside.
- In periods like the AI ramp, the margin question is whether gross profit expands faster than cost of sales; the investor focus should be on gross margin trend, not revenue alone.
- Over the next 1–3 years, the onshoring and tariff regime will determine whether Hon Hai converts AI/server mix changes into structurally higher gross profit or remains cost-pass-through.
- Quanta’s TTM revenue was $2.98T TWD, indicating AI server demand can drive company-wide scale without guaranteeing margin expansion.
- The relevant bet is whether server mix shifts raise gross profit faster than outsourced manufacturing and component costs; revenue growth is not sufficient by itself.
- In coming quarters, monitor whether the gross profit line grows faster than the cost-of-revenue line as AI server shipments mature.
- Wistron’s server/IT revenue scale provides a pathway to capture AI server volume, but the margin mechanism depends on landed cost control and write-down risk.
- Because the ODM layer’s gross profit is sensitive to production/expedite and mix changes (as seen in Supermicro’s filings), Wistron’s margin should be treated as cost-structure-driven, not demand-driven.
- Over 1–3 years, the winners are likely those who reduce tariff/expedite drag through sourcing and assembly footprint changes, not just those with higher unit volumes.
- NVIDIA’s reported profitability profile is dramatically higher than the ODM layer; its TTM operating margin and gross margin remain structurally elevated, helping it retain most value capture upstream of the rack build-out.
- As long as hyperscalers keep buying AI GPU throughput, NVIDIA’s revenue concentration on silicon supply should remain less exposed to tariff/expedite cost mechanics that dominate ODM gross margin.
- Over the next 1–2 quarters, the risk is demand digestion; but the margin-map point is that upstream pricing power offsets downstream margin compression.
- Dell’s rack-scale exposure means it can capture system-level demand, but its gross margin sensitivity depends on how much component and assembly cost shock flows through—consistent with ODM margin math seen in Supermicro’s filing.
- If Dell relies more on external integration and component supply, tariff and expedite-driven cost of sales can cap margin improvements even when AI server revenue grows.
- Over the next 1–3 years, Dell’s competitive angle depends on whether it can stabilize build costs via supply-chain footprint optimization rather than relying on GPU demand alone.