%22%2F%3E%0A%20%20%3Ccircle%20cx%3D%22220%22%20cy%3D%22150%22%20r%3D%22180%22%20fill%3D%22%2322d3ee%22%20fill-opacity%3D%220.12%22%2F%3E%0A%20%20%3Ccircle%20cx%3D%221010%22%20cy%3D%22130%22%20r%3D%22220%22%20fill%3D%22%2338bdf8%22%20fill-opacity%3D%220.08%22%2F%3E%0A%20%20%3Ccircle%20cx%3D%22920%22%20cy%3D%22520%22%20r%3D%22170%22%20fill%3D%22%2322d3ee%22%20fill-opacity%3D%220.06%22%2F%3E%0A%20%20%3Cpath%20d%3D%22M140%20430h920%22%20stroke%3D%22url(%23line)%22%20stroke-width%3D%2212%22%20stroke-linecap%3D%22round%22%2F%3E%0A%20%20%3Cpath%20d%3D%22M220%20360c120-150%20260-220%20380-220s260%2070%20380%20220%22%20fill%3D%22none%22%20stroke%3D%22%2367e8f9%22%20stroke-opacity%3D%220.5%22%20stroke-width%3D%2216%22%20stroke-linecap%3D%22round%22%20stroke-linejoin%3D%22round%22%2F%3E%0A%20%20%3Cpath%20d%3D%22M300%20398h600%22%20stroke%3D%22%2394a3b8%22%20stroke-opacity%3D%220.24%22%20stroke-width%3D%228%22%20stroke-linecap%3D%22round%22%2F%3E%0A%20%20%3Ctext%20x%3D%22220%22%20y%3D%22510%22%20fill%3D%22%23e2e8f0%22%20fill-opacity%3D%220.7%22%20font-family%3D%22Arial%2C%20Helvetica%2C%20sans-serif%22%20font-size%3D%2238%22%20letter-spacing%3D%228%22%3EINSIGHTS%3C%2Ftext%3E%0A%3C%2Fsvg%3E)
What was approved (and what it really moves)
This isn’t a crude pipeline—Western Gateway is a refined-products tariff/margin hedge built on reversals
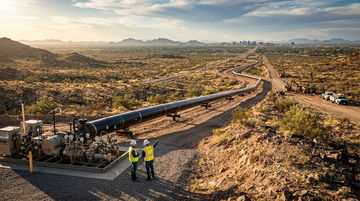
Western Gateway is a $5B, ~1,300-mile refined-products pipeline system that moves volumes between Midcontinent/Gulf Coast origins and Arizona/California markets, using a combination of new-build and reversed existing lines. On Aug. 11, 2026, Reuters reported the joint venture’s final proceed decision and project economics—with Phillips 66 owning 49.9%, Kinder Morgan 35.1%, and HF Sinclair 15%—and highlighted the core mechanism: reversals that reorient transportation flows to the West.
Project value
$5B
Reuters on final proceed decision
System length
1,300 miles
Reuters on system scope
Design capacity
230,000 bpd
Reuters on design capacity
Target in-service
mid-2029
Reuters + Kinder Morgan project page
| Item | What it does | Where it fits in the system |
|---|---|---|
| New-build segment | Creates a direct corridor from the Texas panhandle into Phoenix | Borger, Texas → Phoenix, Arizona |
| SFPP reversal | Reorients existing pipeline flow to enable east-to-west product movement into California | Colton, California ↔ Phoenix, Arizona (reversed for westbound flows into CA) |
| Gold Pipeline reversal | Reorients Phillips 66’s Borger → St. Louis line to feed the Western Gateway east-to-west system | Borger, Texas → St. Louis, Missouri (reversed) |
| Contracting | Anchors the project with long-term reservations (take-or-pay economics) | Primarily ~10-year take-or-pay contracts |
Why it’s being built now
The “tariff/refining-margin regime” payoff comes from logistics optionality, not crude physics
Tariffs and shifting refining margins tend to widen regional price/benefit spreads. In that setting, the economic value of midstream isn’t just “moving molecules,” it’s locking in transportation directionality so refiners/marketers can capture differential margins without betting everything on spot logistics. Western Gateway’s reversals matter because they rewire the product flow chain using existing infrastructure—lowering the operational friction versus building a single-purpose, fixed-direction corridor.
- Reversing lines reduces the risk of being structurally “stranded” on the wrong side of the regional spread cycle.
- A new-build Borger→Phoenix segment gives a predictable hub-to-market bridge for the rest of the system.
- Take-or-pay structuring shifts demand risk away from the midstream sponsor to contracted counterparties.
Who captures the takeaway
The sponsors split the upside by risk type: Phillips 66 funds construction, Kinder Morgan monetizes operations, HF Sinclair buys certainty
Reuters attributes cash/asset contributions and ownership split across the JV, which effectively maps each sponsor to a distinct economic role. Phillips 66 is positioned as the largest capital contributor, Kinder Morgan as the core operator of the products-pipeline asset base being reversed/combined, and HF Sinclair as the refiners-side strategic shipper/investor buying transportation certainty into Arizona/California demand pools.
| Company | Ownership share | Reported contribution role |
|---|---|---|
| Phillips 66 | 49.9% | Contributes nearly $2.5B in cash |
| Kinder Morgan | 35.1% | Contributes about $250M; contributes existing SFPP East/West line assets valued at ~ $1.5B |
| HF Sinclair | 15% | Contributes about $750M |
Who pays (and how the tariff-era risk gets allocated)
The “tariff crude reroute” cost is really the cost of locking long-term refined-products capacity
Even though the market storyline may be described as a crude reroute, the confirmed project is refined products. The payment mechanism sits in long-term transportation contracting: Reuters states the system is underpinned by primarily ~10-year take-or-pay contracts. That means counterparties who benefit from the corridor’s directionality (refiners, marketers, or shippers with secured outlets) pay via reservation charges and minimum-quantity obligations—reducing merchant exposure for the pipeline sponsors.
- Upstream “payers” are effectively the refiners/marketers who need persistent access to Phoenix/CA markets during margin dislocations.
- Midstream “payers” are capital providers, but take-or-pay reduces throughput volatility in cash flows.
- Execution risk (permitting/construction) is the main remaining sponsor risk into 2029.
How sponsor cash/asset burdens map to ownership (illustrative, based on Reuters’ reported contributions)
Not a cash-flow forecast; it is a deal-term read-through of who paid for the capacity commitment.
Unit: USD (billions)
Phillips 66 (cash)
Nearly $2.5B in cash
2.5
Kinder Morgan (cash)
About $250M cash contribution
0.3
Kinder Morgan (asset value)
SFPP assets valued at about $1.5B
1.5
HF Sinclair (cash)
About $750M cash contribution
0.8
Supply-chain transmission (upstream + downstream entities)
The corridor tightens refined-products supply into Phoenix/California by chaining Midwest/Gulf Coast refinery flow to reversals and terminal connectivity
Western Gateway’s supply chain is easiest to visualize as a chain of capabilities: (1) Midcontinent/Gulf Coast refined barrels reach Borger, Texas; (2) a new-build Borger→Phoenix link moves volumes toward Arizona; (3) reversed SFPP and the reversed Gold Pipeline reposition product flow further toward California; and (4) terminal/market connectivity (Phoenix and beyond) ensures those volumes can be distributed downstream. Kinder Morgan’s project description confirms the configuration as a combined new-build plus reversed SFPP segment to enable east-to-west flows into California, anchored by Phoenix and California connectivity.
| Layer | Entity | Link to Western Gateway |
|---|---|---|
| Upstream (system origins) | Midwest refinery supply + Gulf Coast origin points | Reuters describes origins feeding into the system; project design is to supply Arizona/California markets |
| Upstream (pipeline backbone operator) | Kinder Morgan | Contributes SFPP assets and is the primary operating party in the corridor |
| Upstream (routing reversals) | Phillips 66 Gold Pipeline | Reuters and Kinder Morgan’s page describe the Borger→St. Louis line being reversed to feed the east-to-west system |
| Downstream (market reach) | Phoenix, Arizona and California markets | Kinder Morgan project page describes connectivity into Phoenix and California |
| Downstream (refiner-side sponsor/shipping counterpart) | HF Sinclair | HF Sinclair participates as a 15% sponsor contributor, aligning it with secured distribution outcomes |
Fundamentals and momentum read-through (what the numbers imply for sponsors)
This JV is a portfolio-style capex commitment: it can stabilize earnings into the 2029 execution window
From a fundamentals lens, the sponsors vary in financial structure, but the JV’s economic design is midstream-like: it is capital intensive yet contract-anchored. Using tool-provided baseline profiles for each listed sponsor, you can at least frame their current scale and cash generation capacity—even though the JV economics themselves are deal-specific and not disclosed as full pro forma guidance in this session.
- Short term: the immediate stock catalyst is deal finalization and permitting/contracting confidence into mid-2029.
- Medium term: the market will price how much contracted throughput the JV actually captures once open season contracting is fully translated into booked revenues.
- Long term: reversals and connectivity become a durable West Coast logistics moat if execution stays on schedule.
Earnings & execution horizons
Short-term catalyst: de-risked FID. Long-term watch: contracting conversion and construction schedule discipline into mid-2029
In days-to-quarters, FID/final proceed decisions tend to move the market because they de-risk capex timing and signal that shipper demand is solid enough to underwrite the corridor. Over 1–3 years, the biggest uncertainties are (1) whether permits and construction proceed without cost/timeline shocks and (2) whether the JV’s contracted volumes translate into durable utilization. The key question for investors is whether the corridor becomes a consistent utilization engine once it begins operating.
Listed supply-chain beneficiaries (where the JV’s economics can transmit)
- Because the project converts SFPP assets into an east-to-west corridor, Kinder Morgan captures more utilization optionality as volumes shift across regions.
- Take-or-pay backing means Kinder Morgan can earn through the downturn window before 2029 completion, reducing throughput volatility versus merchant corridors.
- Phillips 66’s lead capital role implies $2.5B+ of cash commitment scales corridor control and construction leadership, supporting a higher earnings leverage profile if execution holds.
- By reversing the Gold Pipeline, Phillips 66 repositions its midstream logistics to supply constrained West markets, improving exposure to regional refined-product differentials.
- HF Sinclair can secure distribution outlets because the JV ties its 15% stake to transportation certainty into Phoenix/California markets.
- The risk is timing: the system is targeted for mid-2029, so HF Sinclair faces interim execution uncertainty before utilization benefits materialize.
- If refined-product capacity tightens in Phoenix/California via Western Gateway, Plains All American faces potential relative share pressure in certain westbound refined-product logistics trades.
- Long-term, the corridor’s contractual structure can lock in competitive advantage for the sponsors, limiting incremental spot opportunities for less integrated players.