%22%2F%3E%0A%20%20%3Ccircle%20cx%3D%22220%22%20cy%3D%22150%22%20r%3D%22180%22%20fill%3D%22%2322d3ee%22%20fill-opacity%3D%220.12%22%2F%3E%0A%20%20%3Ccircle%20cx%3D%221010%22%20cy%3D%22130%22%20r%3D%22220%22%20fill%3D%22%2338bdf8%22%20fill-opacity%3D%220.08%22%2F%3E%0A%20%20%3Ccircle%20cx%3D%22920%22%20cy%3D%22520%22%20r%3D%22170%22%20fill%3D%22%2322d3ee%22%20fill-opacity%3D%220.06%22%2F%3E%0A%20%20%3Cpath%20d%3D%22M140%20430h920%22%20stroke%3D%22url(%23line)%22%20stroke-width%3D%2212%22%20stroke-linecap%3D%22round%22%2F%3E%0A%20%20%3Cpath%20d%3D%22M220%20360c120-150%20260-220%20380-220s260%2070%20380%20220%22%20fill%3D%22none%22%20stroke%3D%22%2367e8f9%22%20stroke-opacity%3D%220.5%22%20stroke-width%3D%2216%22%20stroke-linecap%3D%22round%22%20stroke-linejoin%3D%22round%22%2F%3E%0A%20%20%3Cpath%20d%3D%22M300%20398h600%22%20stroke%3D%22%2394a3b8%22%20stroke-opacity%3D%220.24%22%20stroke-width%3D%228%22%20stroke-linecap%3D%22round%22%2F%3E%0A%20%20%3Ctext%20x%3D%22220%22%20y%3D%22510%22%20fill%3D%22%23e2e8f0%22%20fill-opacity%3D%220.7%22%20font-family%3D%22Arial%2C%20Helvetica%2C%20sans-serif%22%20font-size%3D%2238%22%20letter-spacing%3D%228%22%3EINSIGHTS%3C%2Ftext%3E%0A%3C%2Fsvg%3E)
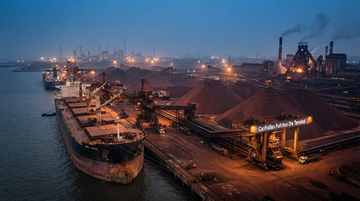
The fastest way to misread iron ore is to treat it like a standalone commodity chart. In reality, iron ore is the financial proxy for China’s steel conversion rate—how quickly imported ore becomes hot metal, then rebar, then the marginal consumption that shows up in capex cycles.
When the market prints a 13-month low, it’s not only “risk-on/off” sentiment. It’s a stress test on Beijing’s policy transmission: can stimulus lift steel demand enough to clear the higher-cost segments of the supply curve, and still keep the steel value chain funded for the next build cycle?
1) What the market is pricing now
China steel may look weak in data—but imports and inventories say “not simply weaker demand”
The core issue is mismatch. China’s broader steel narrative can look soft, yet iron-ore demand can remain surprisingly resilient because mills rebuild inventories, and because domestic production-by-iron-content can shift the need for seaborne ore.
China iron ore imports (1H2026)
628.87M tons
Up 6.3% YoY (first six months of 2026)
China iron ore imports (June 2026)
112.69M tons
Up 6.4% YoY; cited as a six-month high
Port stockpiles (week to Jul 17, 2026)
156.6M tons
Down from 166.9M mid-March; port inventory signal
Port stockpiles vs. prior year
+19.6%
Compared with 130.9M tons in the same week of 2025
What the signals imply (and what they don’t)
Imports rising
Supports continued seaborne demand
Per Reuters, first half 2026 imports rose 6.3% YoY
Stockpiles falling
Suggests some inventory drawdown
Per Reuters, SteelHome port stockpiles fell to 156.6M
Still +19.6% vs. last year
Demand isn’t “overheated” yet
Inventory remains elevated vs prior-year levels
2) Why the higher-cost supply chain is where the trade is
Lower iron ore doesn’t just cut producer revenue—it changes who gets economic clearance to keep shipping
The bulk-materials chain has a built-in asymmetry: low-cost sources can keep producing and can even gain share, while higher-cost supply needs sufficiently firm benchmark pricing to stay funded. That’s why iron ore’s move matters for the entire “steel-making input → steel output → infrastructure capex” pipeline, not only for miners.
| Supply-chain layer | What iron ore does | Investor read-through | First quarter likely to move |
|---|---|---|---|
| Upstream (iron ore miners / pellets) | Tightens cash margins and forces cost discipline | Risk that higher-cost supply is curtailed next | Weeks to next earnings guide |
| Midstream (steelmakers, converters) | Reduces input costs but can signal weaker end demand | Margin relief can appear even if volumes are flat | Next earnings print; tradeable quickly |
| Downstream (infrastructure + industrial capex) | Determines whether steel projects proceed | If stimulus clears the steel gap, demand holds longer | 1–2 quarters lag |
This is the “threat” Bloomberg-style framing gets right—price pressure is a threat to higher-cost supply. But the investor relevance is wider: if the same move also implies margin relief for steel, then miners and steelmakers can receive opposite signals from the same iron ore tape.
3) Turning the headline into an earnings-and-capex question
If Beijing stimulus is strong enough, the steel value chain holds; if not, the ore tape stays bearish
The missing variable in most commodity articles is the “clearance level”: the price/volume combination required for higher-cost supply to keep operating while steel demand stabilizes. In the real chain, steel demand has to be firm enough for inventories to stop building and for mills to run hard enough to absorb seaborne supply.
Using the Reuters signals above, you can see the shape of the clearance problem. Imports are still up YoY and port stockpiles have eased from mid-March highs, but inventory remains materially above last year (+19.6%). That’s consistent with a market that is not yet confident the policy mix can close the demand gap.
4) Who benefits (US/EU steel) and who gets taxed (Vale/BHP/Rio) — with data
Iron ore pressure can compress miner earnings, while still offering temporary margin relief to steelmakers
To make the supply-chain read tradable, you need the financial sensitivity side: steelmakers’ earnings can improve with lower ore costs, while ore producers’ revenue is directly exposed to realized prices and volume. Below are verified listed linkages for the upstream and downstream ends of the chain.
BHP revenue (quarterly, Q2 2025-12-31 period in data)
$27.95B
From the data tool income statement slice
Recent quarterly earnings power: BHP vs Nucor (directional read-through)
Numbers are from data-tool income statement slices used for this article (not a full history).
Unit: USD
The point isn’t to forecast earnings from a single slice. It’s that the mechanism is asymmetric: miners feel pricing pressure immediately, while downstream steel can show margin and cash-flow sensitivity with a lag depending on procurement strategy and product pricing.
5) Supply-chain causality into “AI capex steel” (what can and cannot be inferred)
Transformer/data-center steel demand is downstream, but iron ore is the “rate-limiter”
AI capex increases the type of steel demand (transformer cores, grid upgrades, data-center structures), but the chain still starts with iron ore pricing because it sets baseline steelmaking economics across the industry. Even if the end use is bullish, the market can still punish higher-cost supply if steel throughput is not clearly accelerating.
Important limitation: the open web sources retrieved in this session did not provide a primary, quantitative bridge from “iron ore down at a 13-month low” to a specific “AI transformer steel tonnage” number. That read-through is therefore kept qualitative here, while the iron ore demand verification stays grounded in Reuters inventory/import evidence.
6) Horizons: what moves first vs what must be true next
Short term: ore tape pressures guidance; medium term: inventories determine whether stimulus clears
- In the next days-weeks, the tradable signal is iron ore’s direction vs inventory draws, because that sets expectations for steel demand consistency.
- In the next quarter, look for whether steel companies describe margin relief holding up or if demand softness forces pricing concessions.
- Over 1–3 years, the structural question is whether policy can reduce inventory overhang faster than new supply ramps (which controls the long-run clear price).
7) Bottom line thesis
Iron ore’s 13-month low is a demand-clarity event: it pressures higher-cost supply while testing whether China can fund the next steel capex swing
Here’s the investable frame. China import and inventory data show demand is not collapsing, but it’s also not yet clean enough to assure the market that higher-cost ore remains necessary. That combination—imports up, stockpiles still elevated vs last year—is exactly the setup where stimulus must do “more work” to re-accelerate steel conversion.
For investors, the actionable contrast is: upstream gets taxed by price pressure, while downstream can get an input-cost tailwind even before volumes improve. The trade only flips durable when inventories stop being a drag.
Listed stocks with evidence-backed linkage to this chain (upstream ores + downstream steel)
- BHP's iron ore earnings are more sensitive to benchmark price drops than to incremental inventory drawdowns in China.
- If iron ore stays weak, BHP is forced to lean harder on cost discipline in upcoming guidance cycles (quarters).
- Prolonged bearish ore clears lower-cost producers first, compressing realized pricing optionality for peers.
- Rio Tinto faces margin pressure when iron ore benchmarks fall, because revenue is directly tied to iron-ore conditions (immediate).
- If China policy fails to draw down inventories, Rio Tinto is more likely to see softer pricing in 1–2 quarters than volume relief.
- Relative resilience depends on mix, but sustained weak ore implies valuation rerates downward in risk-off regimes.
- Vale is exposed to iron ore price weakness through realized revenue, which is exactly what low benchmark prints usually trigger.
- If the clearance level isn’t met, Vale risks higher-than-planned cash-flow volatility in the next guidance window (quarters).
- A market that keeps inventories elevated implies continued pressure on seaborne pricing beyond the immediate print.
- Nucor can get temporary margin relief from lower iron ore/input economics even before demand visibly improves (weeks-to-quarters).
- If ore pressure reflects demand weakness, Nucor may see second-order downside via pricing/volume; earnings impact depends on product pricing discipline (quarters).
- If stimulus ultimately clears the gap, Nucor benefits from rebound steel throughput after inventory overhang is absorbed (1–3 years).
- ArcelorMittal is likely caught between input-cost tailwind and demand-cycle risk tied to China steel conversion (quarters).
- If ore weakness persists, ArcelorMittal gains through short-term cost relief, but only as long as steel pricing holds.
- Over 1–3 years, the market treats policy clearance as the key determinant of high utilization vs structural downcycle.
- POSCO Holdings is a global steel bellwether, so its margins can react to ore-driven steel cost changes quickly (days-to-quarters).
- The key watch item is whether China policy clears the steel demand gap; if it does, POSCO Holdings may benefit from improved global pricing (1–3 years).
- If ore weakness reflects durable demand softness, POSCO Holdings faces utilization-driven downside despite cost reductions.