%22%2F%3E%0A%20%20%3Ccircle%20cx%3D%22220%22%20cy%3D%22150%22%20r%3D%22180%22%20fill%3D%22%2322d3ee%22%20fill-opacity%3D%220.12%22%2F%3E%0A%20%20%3Ccircle%20cx%3D%221010%22%20cy%3D%22130%22%20r%3D%22220%22%20fill%3D%22%2338bdf8%22%20fill-opacity%3D%220.08%22%2F%3E%0A%20%20%3Ccircle%20cx%3D%22920%22%20cy%3D%22520%22%20r%3D%22170%22%20fill%3D%22%2322d3ee%22%20fill-opacity%3D%220.06%22%2F%3E%0A%20%20%3Cpath%20d%3D%22M140%20430h920%22%20stroke%3D%22url(%23line)%22%20stroke-width%3D%2212%22%20stroke-linecap%3D%22round%22%2F%3E%0A%20%20%3Cpath%20d%3D%22M220%20360c120-150%20260-220%20380-220s260%2070%20380%20220%22%20fill%3D%22none%22%20stroke%3D%22%2367e8f9%22%20stroke-opacity%3D%220.5%22%20stroke-width%3D%2216%22%20stroke-linecap%3D%22round%22%20stroke-linejoin%3D%22round%22%2F%3E%0A%20%20%3Cpath%20d%3D%22M300%20398h600%22%20stroke%3D%22%2394a3b8%22%20stroke-opacity%3D%220.24%22%20stroke-width%3D%228%22%20stroke-linecap%3D%22round%22%2F%3E%0A%20%20%3Ctext%20x%3D%22220%22%20y%3D%22510%22%20fill%3D%22%23e2e8f0%22%20fill-opacity%3D%220.7%22%20font-family%3D%22Arial%2C%20Helvetica%2C%20sans-serif%22%20font-size%3D%2238%22%20letter-spacing%3D%228%22%3EINSIGHTS%3C%2Ftext%3E%0A%3C%2Fsvg%3E)
Verified event + what it actually changes
Genesis Mission is DOE’s federal accelerator for AI-enabled national infrastructure—starting with DOE lands and power build-out
The Department of Energy (DOE) has used the “Genesis Mission” banner to describe a national effort that connects DOE National Labs, industry, academia, and partners into a platform for AI-enabled breakthroughs—explicitly tied to DOE’s role in energy dominance and infrastructure modernization.
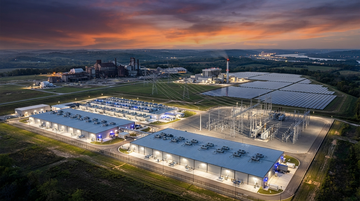
On the siting side, DOE previously laid groundwork for AI data center and energy generation development on federal/DOE-selected sites. In a July 24, 2025 announcement, DOE selected four locations to move forward for next-step solicitations aimed at “cutting edge AI data center and energy generation projects,” including Paducah Gaseous Diffusion Plant in far-western Kentucky.
Taken together, the practical change for AI power economics is that federal land/power enablement can act like a schedule-and-cost backstop for developer build plans—meaning interconnect timelines and “effective power price” can become less speculative than in purely merchant/private pathways.
What DOE has disclosed (no inference)
Genesis Mission (what it is)
AI-enabled “world’s most powerful scientific platform” connecting labs, industry, academia (ASSP)
DOE description.
Western Kentucky linkage (which DOE site)
Paducah Gaseous Diffusion Plant selected as one of four sites
DOE site-selection announcement supporting future solicitations for AI data center + energy projects.
Mechanism (what changes for developers)
Next-step solicitations for private partners on selected DOE sites
DOE frames partnership path and federal land enablement.
| Fact | Source URL | What we used it for |
|---|---|---|
| Genesis Mission description (DOE platform, ASSP framing) | https://www.energy.gov/undersecretaryforscience/genesis-mission/genesis-mission | Define the initiative and its energy/infrastructure framing |
| July 24, 2025 DOE site selection for AI data center + energy generation projects, including Paducah | https://www.energy.gov/articles/doe-announces-site-selection-ai-data-center-and-energy-infrastructure-development-federal | Identify the Western Kentucky DOE land linkage |
Supply-chain map
The economics shift happens at the interconnect layer: federal acceleration reduces the cost of delay for power, turbines, and grid upgrades
AI power-site economics usually get “priced” through three interacting variables:
1) how quickly developers can secure generation and grid capacity 2) how much of the project’s power cost is locked early versus exposed to escalation 3) how predictable the permitting/enablement timeline becomes for interconnection, substations, and upgrades
DOE’s specific disclosure that it selected Paducah for AI data center + energy generation partner development matters because interconnect and grid-capex are where schedule risk becomes cash-flow risk. If schedule risk shrinks, power procurement can be structured with less contingency and fewer “carry” costs.
This is why the announcement’s impact fans out upstream (transmission hardware, engineering, construction labor, generation equipment) and downstream (hyperscalers/cloud capacity bookings, colocation economics, and potentially the regional utility’s contracting velocity).
- Upstream power hardware and services typically accelerate first because grid and substation scopes must be designed before turbines/energy assets are fully staged.
- Co-located generation (gas turbines, pipelines for fuel, and other dispatchable capacity) becomes easier to finance when interconnect dates are less uncertain.
- Downstream hyperscalers care less about a “headline $/MWh” and more about total delivered capacity risk (availability, curtailment exposure, and schedule certainty).
Competitor framing
Western Kentucky gains a “credible AI site” narrative versus capacity-constrained grid hubs—if interconnect risk compresses
The policy trade here is narrative + schedule credibility. Many investors have already internalized that AI demand growth pressures transmission constraints and pushes developers toward locations where capacity and build timing are clearer.
DOE’s disclosed path—using DOE-selected federal sites for AI data center + energy generation partner development—lets Kentucky compete for hyperscaler investment not only on “land and power,” but on the probability distribution of when delivered capacity arrives.
Importantly, this doesn’t say Kentucky will always be cheapest on a pure $/MWh basis. It says the federal enablement can shift the “effective delivered capacity cost” by compressing timeline risk—a key differentiator when PJM-style constraints cause waiting costs.
Illustrative link from policy credibility → developer finance cost (conceptual, not a measured DOE number)
This chart is conceptual: it shows the direction investors should think about when a federal backstop reduces schedule uncertainty. (No claim of quantified magnitude because DOE disclosures in the sources we opened don’t provide this elasticity.)
Unit: relative index (0–5)
Interconnect timeline certainty
Higher when federal partner-siting accelerates enablement
3
Project carry/contingency costs
Lower when fewer delays force additional cost buffers
2
Weighted cost of delivered capacity
Falls when delivered capacity arrives sooner with less uncertainty
1
Company fundamentals (listed companies only) + why they’re in the thesis
What to watch in public markets: utilities with grid build momentum and cloud platforms that translate power availability into bookings
Brookfield Infrastructure Partners's revenue scale (latest FY)
$24.01B
Latest annual revenue in tool snapshot; annual figure from data tool.
Why these listed names belong in an “event → transmission” article:
- Utilities and grid-execution-heavy infrastructure platforms are the obvious public-market proxies for the interconnect and upgrade layer that is most schedule-sensitive.
- Cloud providers are the downstream conversion layer: power availability at a credible site affects how quickly they can commit capacity (or how expensive it becomes to wait).
However, the sources we opened for DOE’s Genesis Mission and its Western Kentucky siting link did not disclose specific counterparties for Paducah power procurement or named hyperscaler bookings. So, the public-company component of this article is framed as a watch list anchored to fundamentals, not as a claim about contractual relationships.
Non-obvious causal chain
Genesis Mission’s “federal land + partnership solicitations” reduces developer option value lost to grid bottlenecks—so grid build can earn a faster payback window
Here’s the chain investors often miss:
When grid constraints are binding, developers price in waiting risk. That risk shows up as either higher delivered-capacity prices or delayed project start dates.
DOE-selected federal sites change the waiting-risk distribution for certain scopes by enabling private-sector partnership development on DOE lands for AI data center + energy generation. The result is not that electricity becomes cheaper overnight—it’s that the “option value” of waiting declines for builders who can align interconnect engineering with a credible enablement path.
That tends to favor parties who can mobilize grid execution quickly (planning, procurement, construction) because they can capture earlier capacity availability, improving project internal-rate-of-return timing.
- If interconnect engineering and substation upgrade timing becomes more predictable, utilities and grid contractors can bid and staff projects with less schedule uncertainty.
- Earlier delivered capacity improves cloud/hyperscaler deployment cadence, which can shift demand from speculative to booked capacity earlier in the cycle.
- For power generation co-location, reduced waiting risk improves financing terms and reduces the need for large contingency allowances.
Horizons
Near term: watch for partnership solicitations and permitting momentum; 1–3 years: watch delivered capacity conversion into data-center build starts
- Monitor DOE follow-on solicitations and site-specific partnership selections because they determine which interconnect/generation scopes become fundable next.
- Near term (weeks–quarters): procurement and engineering activity should show up first in the infrastructure supply chain even before data-center revenue statements.
- Medium term (1–3 years): the key indicator is whether announced sites translate into committed MW of delivered capacity (build starts and energized interconnect dates).
- Risk: if grid upgrades face non-federal constraints (regional transmission limitations, equipment lead times), the “backstop” may accelerate planning without fully removing physical bottlenecks.
Related listed beneficiaries (and what data suggests to watch)
- If interconnect timelines compress at DOE-enabled sites, NextEra Energy can translate higher grid execution velocity into contracted revenue visibility over the next 1–3 years.
- A credible AI power-site pipeline supports NextEra Energy's scale advantages as revenue reached $27.48B in FY 2025 (capacity-building backdrop).
- Near term, watch for utility-like capex cadence consistent with grid build-up rather than wholesale generation alone.
- Brookfield Infrastructure Partners sits across utility and infrastructure execution; accelerated interconnect schedules could improve project timing but competition and financing costs can offset gains within 1–3 years.
- BIP's latest annual revenue in the data tool is ~$24.01B, giving it capacity to underwrite infrastructure projects tied to grid expansion.
- Near term, the “win” would be faster-to-build scopes (planning/procurement execution) rather than immediate earnings jumps.
- If credible power sites reduce AI deployment uncertainty, Alphabet should face less incremental friction in datacenter capacity planning; this is observable only after build starts in 1–3 years.
- GOOG's FY 2025 revenue was $402.96B, meaning it can absorb some power-cost variability, but schedule risk is still a gating factor for capacity ramp.
- Near term, watch for capex narrative shifts tied to capacity availability rather than unit economics.
- If power availability at DOE-enabled Kentucky reduces wait costs, Amazon should find it easier to convert AI demand into committed capacity—timing should show up in 1–3 years.
- AMZN generated $716.92B revenue in FY 2025; the question is less “can it pay” and more “can it ramp capacity sooner.”
- Near term, the measurable proxy is whether AWS supply/demand guidance improves alongside infrastructure build milestones.