Waste Connections, Inc. is a leading environmental services provider that delivers a full spectrum of non-hazardous waste management solutions, including collection, transfer, ...
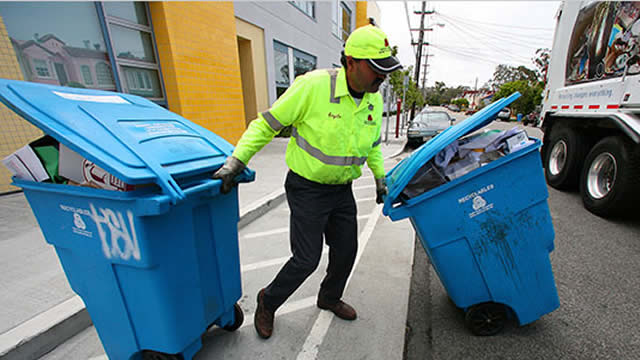
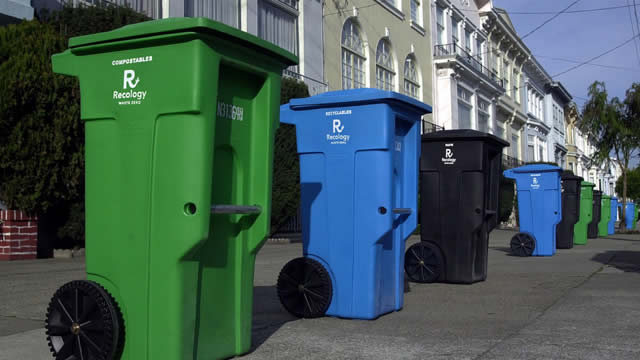
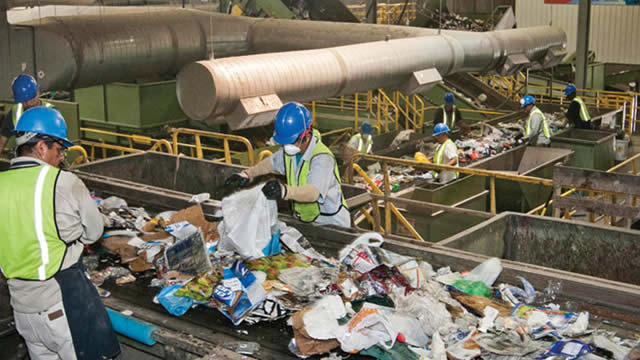
Waste Connections, Inc. (NYSE: WCN) is an integrated waste services provider focused on managing non-hazardous solid waste from generation to final disposition and improving diversion through recycling and resource recovery. The company operates a wide network of collection routes, transfer stations, landfills (including municipal solid waste and E&P waste landfills), ...Waste Connections, Inc. (NYSE: WCN) is an integrated waste services provider focused on managing non-hazardous solid waste from generation to final disposition and improving diversion through recycling and resource recovery. The company operates a wide network of collection routes, transfer stations, landfills (including municipal solid waste and E&P waste landfills), recycling facilities, and intermodal services in both the United States and Canada. Its core offering spans the full waste value chain: (1) collection of waste from residential, commercial, municipal, and industrial customers; (2) transfer and logistics, where waste is received, compacted, and loaded for efficient transport by truck, rail, or barge; (3) disposal through owned and operated landfill systems; and (4) recycling programs that sort and process materials such as compostables, cardboard, mixed paper, plastic containers, glass bottles, and ferrous and aluminum metals.
Beyond traditional solid waste, Waste Connections also supports the waste handling needs of oil and natural gas exploration and production through specialized treatment, recovery, and safe disposal of E&P-related wastes (e.g., drilling fluids, drill cuttings, completion fluids, flowback water, produced water, contaminated soils requiring remediation, and cleanup wastes after spills, reserve pit operations, or pipeline ruptures). This diversified capabilities mix can help stabilize demand across different customer categories, including both consumer/municipal and industrial/E&P markets.
From an operating-cost and “BOM” perspective, the business model relies on heavy assets and continuous field operations: labor (drivers, MRF personnel, landfill operations staff), transportation equipment and fleet management, containers and routing systems, and landfill/transfer infrastructure. Recycling operations require sorting/processing equipment and quality controls to maximize recovery rates, while landfill operations depend on permitted capacity, leachate/environmental systems, and ongoing maintenance. Capital intensity is material due to infrastructure—landfills, transfer stations, recycling facilities, and intermodal logistics—but the company’s scale and asset network can support utilization and economies of scope.
Financially, Waste Connections is commonly evaluated on margins linked to contract structures, fuel and labor costs, landfill volumes, and recycling commodity pricing. Public-company metrics (e.g., cash generation and return measures) typically reflect the balance between operating cash flow and capital expenditures needed to expand or maintain permitted capacity and facilities. Key leadership includes CEO Ronald J. Mittelstaedt. Strategically, the company’s “wishes” and priorities usually align with expanding its footprint through acquisitions and new facility development, maintaining safety and environmental compliance, and improving waste diversion through recycling and resource recovery—while continuing to run and optimize its large network of collection routes, transfer operations, and disposal assets.
YoYYoY means Year-over-Year. It compares the latest annual value with the previous annual value to show long-term trend strength.
QoQQoQ means Quarter-over-Quarter. It compares the latest quarter with the immediately previous quarter to show short-term momentum changes.
RevenueThe total money that came through the front door from selling things, before paying a single bill. Think of it as the grand total of every credit card swipe from customers. (YoY compares this year to last year's performance, while QoQ compares the current three months to the previous three).
$9.5B
+6.5%
+8.1%
Net IncomeThe absolute bottom line. If the company paid every single supplier, employee, banker, and tax collector, this is the actual money left in their pocket at the end of the day.
$1.1B
+75.0%
+35.1%
Gross MarginThe basic markup. If they sell a $100 pair of sneakers, this percentage tells you how much of that price tag is profit right after paying for the rubber and shoelaces, but before paying for things like store rent or TV commercials.
+39.0%
-6.8%
-0.8%
Operating MarginThe 'day job' efficiency score. Out of every dollar a customer spends, this shows how many cents the company keeps after making the product AND paying for all the everyday corporate overhead (like salaries, marketing, and keeping the lights on).
+18.1%
+51.4%
+11.2%
Net MarginThe final take-home percentage. When you strip away every conceivable cost, tax, and interest payment, this is the exact number of cents the company truly gets to keep from every dollar in sales.
+11.4%
+64.2%
+25.1%
Free Cash FlowThe holy grail of corporate cash. It's the spendable, physical money left over after the business pays for its daily operations AND buys the big, expensive upgrades (like new factories or servers) it needs to survive. This is the 'free' money they can use to pay dividends or buy back stock.
$1.2B
+4.0%
+313.6%
FCF MarginThe ultimate cash conversion rate. It shows how good the company is at turning regular sales directly into cold, hard, spendable cash. A high percentage means the business is an absolute cash-printing machine.
+12.8%
-2.4%
+282.8%
Debt / EquityThe financial risk gauge. It compares how much of the company's empire was built using borrowed money (loans) versus the owners' own money (shareholders). A high number means they are heavily leveraged and playing a riskier game; a low number means they are playing it safe.
114.2%
+6.9%
+3.7%
Current RatioThe 12-month survival check. It simply compares the cash they have right now (plus things they can quickly turn into cash) against the immediate bills they absolutely must pay this year. A score above 1 means they have enough in the wallet to cover the upcoming bills without panicking.
0.62x
-5.5%
-2.8%
Total AssetsThe absolute size of the company's empire. It bundles together absolutely everything of value they own—from the cash in the register and the inventory in the warehouse, to the software patents in the vault and the factories on the ground.
Operator : Hello, everyone. Thank you for joining us, and welcome to the Waste Connections, Inc. Q2 2026 Earnings Call. [Operator Instructions] I will now hand the call over to Ron Mittelstaedt, President and CEO. Ron, please go ahead.
Ronald Mittelstaedt : Okay. Thank you, operator, and good morning, everyone. I'd like to welcome everyone to this conference call to discuss our second quarter results and increased outlook for 2026. I'm joined this morning by members of our senior management team, including our CFO, Mary Anne Whitney, who will first provide our forward-looking disclaimer and other housekeeping items.
Mary Whitney : Thank you, Ron, and good morning. The discussion during today's call includes forward-looking statements made pursuant to the safe harbor provisions of the U.S. Private Securities Litigation Reform Act of 1995, including forward-looking information within the meaning of applicable Canadian securities laws. Actual results could differ materially from those made in such forward-looking statements due to various risks and uncertainties. Factors that could cause actual results to differ are discussed both in the cautionary statement in our July 22 earnings release and in greater detail in Waste Connections filings with the U.S. Securities and Exchange Commission and the securities commissions or similar regulatory authorities in Canada. You should not place undue reliance on forward-looking statements as there may be additional risks of which we are not presently aware or that we currently believe are immaterial, which could have an adverse impact on our business. We make no commitment to revise or update any forward-looking statements in order to reflect events or circumstances that may change after today's date. On the call, we will discuss non-GAAP measures such as adjusted EBITDA, adjusted net income on both a dollar basis and per diluted share and adjusted free cash flow. Please refer to our earnings releases for a reconciliation of such non-GAAP measures to the most comparable GAAP measures. Management uses certain non-GAAP measures to evaluate and monitor the ongoing financial performance of our operations. Other companies may calculate these non-GAAP measures differently. I will now turn the call back over to Ron.
Ronald Mittelstaedt : Okay. Thank you, Mary Anne. We are extremely pleased by the strength of our first half performance, which positioned us for an increase to our full year 2026 outlook with momentum for upside from improving trends in commodities and ongoing acquisition activity. Q2 growth of over 6% in both revenue and EBITDA exceeded our expectations in spite of the macroeconomic effects related to ongoing uncertainty in the geopolitical environment. Our results reflect continued benefits from both multiyear improvements in employee retention and record safety performance and more recent investments in AI technology, all underpinned by disciplined operational execution. Most notably, adjusted …