Is Sunoco Worth Buying for Growth Despite Debt and Refinery Risk?
Sunoco pairs a discounted valuation with rising distributions and broader assets, but high debt and refinery volatility keep the growth case risky.
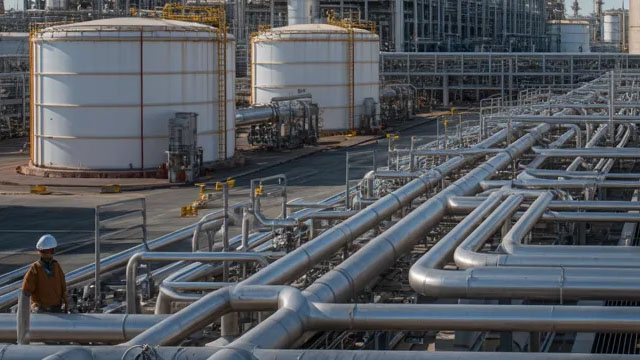

Sunoco LP, together with its subsidiaries, engages in the energy infrastructure and distribution of motor fuels in the United States. It operates ...
Plutux is not an investment adviser. Market data and AI-generated analysis are for information and education only, not investment advice. Disclaimer
Operator: Thank you for standing by. My name is Tina, and I will be your conference operator today. At this time, I would like to welcome everyone to the Sunoco and SunocoCorp Q2 2026 Earnings Conference Call. [Operator Instructions] It is now my pleasure to turn the call over to Scott Grischow, Senior Vice President of Finance. Please go ahead. Scott Grischow: Thank you, and good morning, everyone. On the call with me this morning are Joe Kim, President and Chief Executive Officer; Karl Fails, Chief Operating Officer; Austin Harkness, Chief Commercial Officer; Brian Hand, Chief Sales Officer; and Dylan Bramhall, Chief Financial Officer. Today's call will contain forward-looking statements that include expectations and assumptions regarding Sunoco LP's future operations and financial performance. Actual results could differ materially, and we undertake no obligation to update these statements based on subsequent events. Please refer to our earnings release as well as our filings with the SEC for a list of these factors. During today's call, we will also discuss certain non-GAAP financial measures, including adjusted EBITDA and distributable cash flow as adjusted. Please refer to the Sunoco LP website for a reconciliation of each financial measure. The partnership continued the strong momentum in 2026 with second quarter adjusted EBITDA of $996 million, excluding approximately $14 million of onetime transaction expenses. Based on our first half results and our confidence in the outlook for the second half of the year, we raised our adjusted EBITDA guidance range to be between $3.5 billion and $3.7 billion, an increase of $400 million from our original guidance range. Joe will provide more detail in his remarks, but this increase reflects the strength of our portfolio and realizing the value of recent acquisitions. Second quarter distributable cash flow as adjusted was $608 million. On July 27, we declared a distribution of just over $1 per common unit for both Sunoco LP common units and SunocoCorp shares. This represents a quarterly increase of 1.25% from the prior quarter and over 10% versus the second quarter of 2025. Our business continues to generate strong cash flows, resulting in a trailing 12-month coverage ratio of 2.1x. Our balance sheet and liquidity position remains strong. We had $2.3 billion in availability under our revolving credit facility at the end of the quarter and leverage was approximately 3.7x, below our long-term target. Finally, we spent $125 million on growth capital and $77 million on maintenance capital. I want to wrap up my comments by stating that our financial position is stronger than ever. Our balance sheet is below our long-term target, and our distribution is comfortably on pace to meet our multiyear growth rate of at least 5%. Our proven history of executing on highly accretive acquisitions, both larger transactions and bolt-on opportunities, combined with our quick spend, quick return organic growth projects …
Est. EPS $2.45 · Revenue $11.76B · 3 analysts
Est. EPS $1.98 · Revenue $11.37B · 3 analysts
| Metric | Latest | YoYYoY means Year-over-Year. It compares the latest annual value with the previous annual value to show long-term trend strength. | QoQQoQ means Quarter-over-Quarter. It compares the latest quarter with the immediately previous quarter to show short-term momentum changes. |
|---|---|---|---|
| The total money that came through the front door from selling things, before paying a single bill. Think of it as the grand total of every credit card swipe from customers. (YoY compares this year to last year's performance, while QoQ compares the current three months to the previous three). |
| Name | Title | Compensation | Gender | Year Born | Status |
|---|---|---|---|---|---|
Joseph Kim | President, Chief Executive Officer & Director of Sunoco GP LLC | USD 2,309,148 | Male | 1972 | Active |
Karl R. Fails | Executive Vice President & Chief Operating Officer of Sunoco GP LLC |
| USD 1,324,451 |
| Male |
| 1975 |
| Active |
Brian A. Hand | Executive Vice President & Chief Sales Officer of Sunoco GP LLC | USD 959,382 | Male | 1968 | Active |
Austin Harkness | Executive Vice President & Chief Commercial Officer of Sunoco GP LLC | USD 952,774 | Male | 1980 | Active |
Edward Pak | General Counsel & Assistant Secretary of Sunoco GP LLC | USD 611,070 | — | — | Active |
Chris Cho | Director of Communications - Sunoco GP LLC | — | — | — | Active |
Brian Joseph Brungardt Jr. | Director of Investor Relations of Sunoco GP LLC | — | Male | — | Active |
Dylan A. Bramhall | Chief Financial Officer of Sunoco GP LLC | — | Male | 1977 | Active |
Rick J. Raymer | Vice President, Controller & Principal Accounting Officer of Sunoco GP LLC | — | Male | — | Active |
Scott D. Grischow | Senior Vice President of Finance & Treasurer of Sunoco GP LLC | — | Male | — | Active |
Est. EPS $8.46 · Revenue $47.49B · 4 analysts
Est. EPS $1.76 · Revenue $11.19B · 1 analysts
$3.84 per share
$3.84 per share
| $25.2B |
| +11.1% |
| +33.4% |
| Net IncomeThe absolute bottom line. If the company paid every single supplier, employee, banker, and tax collector, this is the actual money left in their pocket at the end of the day. | $527.0M | -26.4% | -56.1% |
| Gross MarginThe basic markup. If they sell a $100 pair of sneakers, this percentage tells you how much of that price tag is profit right after paying for the rubber and shoelaces, but before paying for things like store rent or TV commercials. | +8.3% | +9.5% | -24.8% |
| Operating MarginThe 'day job' efficiency score. Out of every dollar a customer spends, this shows how many cents the company keeps after making the product AND paying for all the everyday corporate overhead (like salaries, marketing, and keeping the lights on). | +3.7% | +5.8% | -52.5% |
| Net MarginThe final take-home percentage. When you strip away every conceivable cost, tax, and interest payment, this is the exact number of cents the company truly gets to keep from every dollar in sales. | +2.1% | -33.7% | -67.1% |
| Free Cash FlowThe holy grail of corporate cash. It's the spendable, physical money left over after the business pays for its daily operations AND buys the big, expensive upgrades (like new factories or servers) it needs to survive. This is the 'free' money they can use to pay dividends or buy back stock. | $615.0M | +200.0% | +230.2% |
| FCF MarginThe ultimate cash conversion rate. It shows how good the company is at turning regular sales directly into cold, hard, spendable cash. A high percentage means the business is an absolute cash-printing machine. | +2.4% | +170.1% | +147.5% |
| Debt / EquityThe financial risk gauge. It compares how much of the company's empire was built using borrowed money (loans) versus the owners' own money (shareholders). A high number means they are heavily leveraged and playing a riskier game; a low number means they are playing it safe. | 201.1% | +2.3% | +207.8% |
| Current RatioThe 12-month survival check. It simply compares the cash they have right now (plus things they can quickly turn into cash) against the immediate bills they absolutely must pay this year. A score above 1 means they have enough in the wallet to cover the upcoming bills without panicking. | 1.38x | +9.0% | -7.6% |
| Total AssetsThe absolute size of the company's empire. It bundles together absolutely everything of value they own—from the cash in the register and the inventory in the warehouse, to the software patents in the vault and the factories on the ground. | $28.4B | +97.3% | -1.1% |
| Metric | Annual (A vs E) | Annual Surprise | Quarter (A vs E) | Quarter Surprise |
|---|---|---|---|---|
| EPS Surprise | 3.66 vs 4.54 | -19.4% | 1.49 vs 2.45 | -39.1% |
| Revenue Surprise | $25.2B vs $25.2B | +0.0% | $14.3B vs $11.8B | +21.2% |
| Date | Executive | Title | Security | Side | Shares | Price |
|---|---|---|---|---|---|---|
| Jun 25, 2026 | Hand Brian A | officer: EVP-Chief Sales Officer | Common Units | A | 20,000 | — |
| Jun 25, 2026 | Harkness Austin | officer: EVP, Chief Commercial Officer | Common Units | A | 20,000 | — |
| Jan 2, 2026 | Barron Bradley C | director | Common Units | A | 2,436 | — |
| Jan 2, 2026 | Alvarez Oscar A. | director | Common Units | A | 2,436 | — |
| Jan 2, 2026 | Smith W Brett | director | Common Units | A | 2,436 | — |