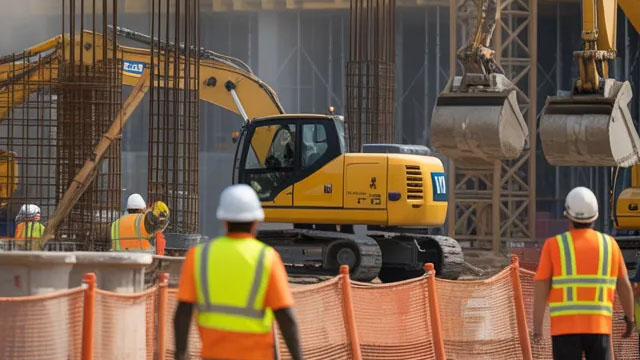
Primoris Services Corporation functions as a prominent specialized contracting firm, offering a wide array of services that include construction, fabrication, upkeep, modernization, ...
Primoris Services Corporation, headquartered in Dallas, Texas, is a leading specialty contractor with a rich history dating back to 1960 when its predecessor ARB, Inc. was founded. The company operates through three primary divisions: Utilities, Energy/Renewables, and Pipeline Services. The Utilities segment installs and maintains natural gas distribution, electrical transmission, ...Primoris Services Corporation, headquartered in Dallas, Texas, is a leading specialty contractor with a rich history dating back to 1960 when its predecessor ARB, Inc. was founded. The company operates through three primary divisions: Utilities, Energy/Renewables, and Pipeline Services. The Utilities segment installs and maintains natural gas distribution, electrical transmission, and communications infrastructure. The Energy/Renewables segment delivers engineering, procurement, and construction (EPC) services, as well as major civil projects like highways, bridges, and flood control, and provides retrofits and maintenance for renewable energy, energy storage, petroleum refining, and petrochemical industries. The Pipeline Services segment focuses on pipeline construction, maintenance, and integrity management, including compressor stations and metering facilities. Primoris employs over 18,500 people and is ranked among the top specialty contractors by Engineering News-Record. Financially, the company has shown steady performance with a market cap around $4.48 billion, a gross profit margin of 8.6%, and a net profit margin of 1.9%. Its revenue per share stands at $134.89, and it has a dividend yield of 0.4%. Key leadership includes CEO Koti Vadlamudi, who took office in November 2025. The company is committed to sustainable infrastructure and has a strong focus on safety and innovation, aiming to build long-term value for stakeholders. With a broad service portfolio and strong project backlog, Primoris continues to expand its footprint in the growing energy and infrastructure markets.
YoYYoY means Year-over-Year. It compares the latest annual value with the previous annual value to show long-term trend strength.
QoQQoQ means Quarter-over-Quarter. It compares the latest quarter with the immediately previous quarter to show short-term momentum changes.
RevenueThe total money that came through the front door from selling things, before paying a single bill. Think of it as the grand total of every credit card swipe from customers. (YoY compares this year to last year's performance, while QoQ compares the current three months to the previous three).
$7.6B
+19.0%
+8.2%
Net IncomeThe absolute bottom line. If the company paid every single supplier, employee, banker, and tax collector, this is the actual money left in their pocket at the end of the day.
$274.9M
+52.0%
-239.1%
Gross MarginThe basic markup. If they sell a $100 pair of sneakers, this percentage tells you how much of that price tag is profit right after paying for the rubber and shoelaces, but before paying for things like store rent or TV commercials.
+10.7%
-2.8%
-43.5%
Operating MarginThe 'day job' efficiency score. Out of every dollar a customer spends, this shows how many cents the company keeps after making the product AND paying for all the everyday corporate overhead (like salaries, marketing, and keeping the lights on).
+5.5%
+9.6%
-185.7%
Net MarginThe final take-home percentage. When you strip away every conceivable cost, tax, and interest payment, this is the exact number of cents the company truly gets to keep from every dollar in sales.
+3.6%
+27.7%
-228.5%
Free Cash FlowThe holy grail of corporate cash. It's the spendable, physical money left over after the business pays for its daily operations AND buys the big, expensive upgrades (like new factories or servers) it needs to survive. This is the 'free' money they can use to pay dividends or buy back stock.
$340.5M
-10.8%
+79.3%
FCF MarginThe ultimate cash conversion rate. It shows how good the company is at turning regular sales directly into cold, hard, spendable cash. A high percentage means the business is an absolute cash-printing machine.
+4.5%
-25.0%
+80.8%
Debt / EquityThe financial risk gauge. It compares how much of the company's empire was built using borrowed money (loans) versus the owners' own money (shareholders). A high number means they are heavily leveraged and playing a riskier game; a low number means they are playing it safe.
75.9%
-10.1%
+25.6%
Current RatioThe 12-month survival check. It simply compares the cash they have right now (plus things they can quickly turn into cash) against the immediate bills they absolutely must pay this year. A score above 1 means they have enough in the wallet to cover the upcoming bills without panicking.
1.26x
-2.3%
-7.8%
Total AssetsThe absolute size of the company's empire. It bundles together absolutely everything of value they own—from the cash in the register and the inventory in the warehouse, to the software patents in the vault and the factories on the ground.
Operator: Welcome to the Primoris Services Corporation First Quarter 2026 Earnings Conference Call and Webcast. All lines have been placed on mute to prevent any background noise. After the speakers' remarks, there will be a question-and-answer session. To ask a question, please press star followed by the number one on your telephone keypad. If you would like to withdraw your question, press star 1 again. I would now like to turn the call over to Blake Holcomb, Vice President of Investor Relations. Please go ahead.
Blake Holcomb: Good morning, and welcome to the Primoris Services Corporation First Quarter 2026 Earnings Conference Call. Joining me today with prepared comments are Koti Vadlamudi, President and Chief Executive Officer, and Ken Dodgen, Chief Financial Officer. Before we begin, I would like to make everyone aware of certain language contained in our Safe Harbor statement. The company cautions that certain statements made during this call are forward-looking and are subject to various risks and uncertainties. Actual results may differ materially from our projections and expectations. These risks and uncertainties are discussed in our reports filed with the SEC. Our forward-looking statements represent our outlook only as of today, 05/06/2026, and we disclaim any obligation to update these statements except as may be required by law. In addition, during this conference call, we will make reference to certain non-GAAP financial measures. A reconciliation of these non-GAAP financial measures is available on the Investors section of our website in our first quarter 2026 earnings press release, which was issued yesterday. I would now like to turn the call over to Koti Vadlamudi.
Koti Vadlamudi: Thank you, Blake. Good morning and thank you for joining us today to discuss our first quarter 2026 financial and operational results. Our first quarter results reflected the impact of a small number of solar projects that experienced cost pressures resulting in lower reported gross profit and margins for the period. These impacts were driven by execution-related factors including specific labor issues, project redesigns, adjustments to sequencing, and weather-related disruptions. The majority of the impacted projects were subsequent to the project discussed in our Q4 earnings call, which experienced cost overruns driven by unforeseen underground conditions. Through our review, we identified two primary drivers behind these challenges: preconstruction planning and the complexity associated with new geographic labor markets. The rapid pace of growth in the solar market placed increased demands on our organization and, in a limited number of cases, this resulted in gaps during the early planning, estimating, and construction phases. Importantly, since these contracts were executed in 2024, we have taken decisive actions to address these areas. We made targeted leadership changes and added experienced talent to strengthen our preconstruction, …