Philip Morris International Inc. functions as a prominent tobacco enterprise, actively working toward a smoke-free future. The company is strategically diversifying its ...
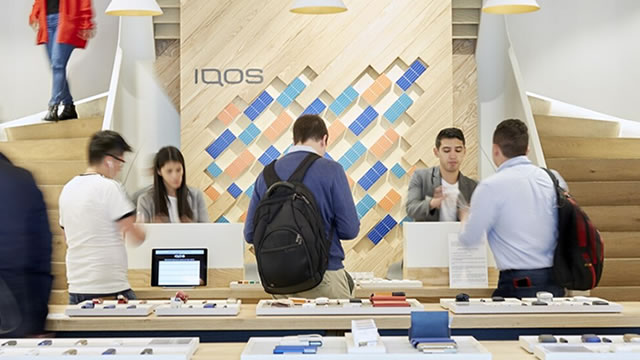
Philip Morris International Inc. (PMI) is a global tobacco and nicotine company headquartered in Stamford, Connecticut, with operations in over 180 markets. The company was originally founded in 1847 in London, but PMI itself was established in 1987 as an operating company of Philip Morris Companies Inc. and became independent ...Philip Morris International Inc. (PMI) is a global tobacco and nicotine company headquartered in Stamford, Connecticut, with operations in over 180 markets. The company was originally founded in 1847 in London, but PMI itself was established in 1987 as an operating company of Philip Morris Companies Inc. and became independent in 2008. PMI employs approximately 84,900 people worldwide. The company's core business is the manufacturing and sale of cigarettes and smoke-free products, including heat-not-burn devices (IQOS), vapor products, and oral nicotine pouches. PMI's portfolio includes well-known cigarette brands such as Marlboro, Parliament, Chesterfield, L&M, and Lark, as well as regional brands like Dji Sam Soe in Indonesia and Fortune in the Philippines. Its smoke-free products, such as HEETS, TEREA, and IQOS, are available in 71 markets. In terms of financials, PMI has a market cap of $295 billion, with a TTM revenue per share of $27.22 and net profit margin of 25.6%. The company generates strong cash flows, with operating cash flow per share of $9.13 and free cash flow per share of $8.14. PMI has a dividend yield of 3.1% and a payout ratio of 82.8%. The company's strategy is focused on becoming a majority smoke-free company by 2030, with a goal to derive over two-thirds of its revenue from smoke-free products. PMI's leadership includes CEO Jacek Olczak, who has been in the role since 2021, and Chairman André Calantzopoulos. The company is listed on the New York Stock Exchange under the ticker PM.
YoYYoY means Year-over-Year. It compares the latest annual value with the previous annual value to show long-term trend strength.
QoQQoQ means Quarter-over-Quarter. It compares the latest quarter with the immediately previous quarter to show short-term momentum changes.
RevenueThe total money that came through the front door from selling things, before paying a single bill. Think of it as the grand total of every credit card swipe from customers. (YoY compares this year to last year's performance, while QoQ compares the current three months to the previous three).
$40.6B
+7.3%
+10.3%
Net IncomeThe absolute bottom line. If the company paid every single supplier, employee, banker, and tax collector, this is the actual money left in their pocket at the end of the day.
$11.3B
+61.3%
+15.5%
Gross MarginThe basic markup. If they sell a $100 pair of sneakers, this percentage tells you how much of that price tag is profit right after paying for the rubber and shoelaces, but before paying for things like store rent or TV commercials.
+67.1%
+3.6%
+0.6%
Operating MarginThe 'day job' efficiency score. Out of every dollar a customer spends, this shows how many cents the company keeps after making the product AND paying for all the everyday corporate overhead (like salaries, marketing, and keeping the lights on).
+36.7%
+3.8%
+5.5%
Net MarginThe final take-home percentage. When you strip away every conceivable cost, tax, and interest payment, this is the exact number of cents the company truly gets to keep from every dollar in sales.
+27.9%
+50.3%
+4.7%
Free Cash FlowThe holy grail of corporate cash. It's the spendable, physical money left over after the business pays for its daily operations AND buys the big, expensive upgrades (like new factories or servers) it needs to survive. This is the 'free' money they can use to pay dividends or buy back stock.
$10.7B
-1.0%
+779.8%
FCF MarginThe ultimate cash conversion rate. It shows how good the company is at turning regular sales directly into cold, hard, spendable cash. A high percentage means the business is an absolute cash-printing machine.
+26.2%
-7.8%
+716.3%
Debt / EquityThe financial risk gauge. It compares how much of the company's empire was built using borrowed money (loans) versus the owners' own money (shareholders). A high number means they are heavily leveraged and playing a riskier game; a low number means they are playing it safe.
-488.6%
-25.6%
-2.2%
Current RatioThe 12-month survival check. It simply compares the cash they have right now (plus things they can quickly turn into cash) against the immediate bills they absolutely must pay this year. A score above 1 means they have enough in the wallet to cover the upcoming bills without panicking.
0.96x
+8.9%
+0.4%
Total AssetsThe absolute size of the company's empire. It bundles together absolutely everything of value they own—from the cash in the register and the inventory in the warehouse, to the software patents in the vault and the factories on the ground.
Operator: Good day, and thank you for standing by. Welcome to the Philip Morris International 2026 second quarter results. At this time, all participants are in listen-only mode. After the speaker's presentation, we will open up for questions with a limit of two questions per person before rejoining the queue. To ask a question during the session, you will need to press star 11 on your telephone. You will hear an automated message advising your hand is raised. To withdraw your question, please press star 11 again. Please be advised that today's call is being recorded. I would now like to hand it over to our first speaker, James Bushnell. Please go ahead.
James Bushnell: Welcome. Thank you for joining us. Earlier today, we issued a press release containing detailed information on our 2026 second quarter results. The press release is available on our website at pmi.com. A glossary of terms, including the definition for Smoke-Free Products, as well as adjustments, other calculations, and reconciliations to the most directly comparable U.S. GAAP measures for non-GAAP financial measures cited in this presentation, are available in Exhibit 99.2 to the company's Form 8-K, dated today, and on our Investor Relations website.
James Bushnell: I am joined today by Emmanuel Babeau and Massimo Andolina, who will succeed Emmanuel as Group CFO in August. Emmanuel, over to you.
Emmanuel Babeau: Thank you, James, and welcome everyone. I am pleased to report a very strong Q2 as we generated +8% organic growth in net revenue and +11% in operating income, driving +14% currency-neutral progression in adjusted diluted earnings per share to $2.20 or +15% in dollar terms. This better-than-expected delivery contributed to very robust H1 growth, despite the tough comparison of the first quarter. Our Q2 results were once again powered by excellent performance, as expected, from our international Smoke-Free Products business, with high single-digit volume growth, double-digit top-line growth, and impressive gross margin expansion. IQOS adjusted in-market sales volume increased by +5%, including expected transitory headwinds from the April excise increase in Japan and the characterizing flavor ban in Poland. Excluding these two markets, double-digit growth continued, reflecting the broad-based strengths of our Smoke-Free Products business across markets.
Emmanuel Babeau: Our multi-category commercial approach continues to gain momentum, supported by ZYN and VEEV. Our combustible performance was above our expectation in an especially strong quarter, with growing volumes, very good pricing, stable category share, and gross profit growth. While we do not expect this delivery to be repeated to the same magnitude for the full year, such results demonstrate the robustness of our portfolio as we leverage our leadership in cigarettes to support the switching of legal-age smokers to better alternatives. In the U.S., we posted a significant sequential improvement in net revenues, …