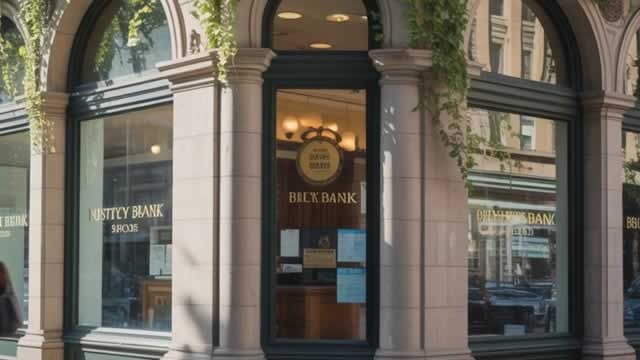
Prosperity Bancshares, Inc. serves as the holding company for Prosperity Bank, providing a comprehensive suite of financial solutions to both individual customers ...
Prosperity Bancshares, Inc. (NYSE: PB) is a regional financial holding company based in Houston, Texas, with operations primarily in Texas and central Oklahoma. As of 2023, the company manages approximately $37.8 billion in total assets and reported a net income of $526.9 million. It serves as the parent company for ...Prosperity Bancshares, Inc. (NYSE: PB) is a regional financial holding company based in Houston, Texas, with operations primarily in Texas and central Oklahoma. As of 2023, the company manages approximately $37.8 billion in total assets and reported a net income of $526.9 million. It serves as the parent company for Prosperity Bank, a community-focused banking institution that offers a wide range of products and services.
Business and Products: The bank provides a diverse array of deposit products, including checking accounts, savings accounts, money market accounts, and certificates of deposit. Its lending portfolio is extensive with offerings in real estate (residential, commercial, multi-family, construction, land development), commercial and industrial financing, agricultural loans, and consumer lending (personal loans, auto, RV, boat, home improvement). Additionally, the bank offers digital banking services such as internet and mobile banking, along with trust and wealth management, retail brokerage, mortgage services, and treasury management.
Operations and Network: As of December 31, 2021, Prosperity Bank operated 273 full-service branches, with a significant presence in Houston, Dallas/Fort Worth, South Texas, East Texas, Central Texas, and West Texas. It also operates in Oklahoma under the LegacyTexas Bank brand. The company places a strong emphasis on community banking, building relationships with customers, businesses, and local communities.
Financial Performance: Prosperity Bancshares maintains a solid financial profile with a market cap of approximately $7.44 billion and a price-to-earnings ratio of about 12.8. The company has a dividend yield of 3.2% and a dividend payout ratio of 52%, reflecting its commitment to returning value to shareholders. With a return on equity of 7.1% and a net profit margin of 31.6%, the bank demonstrates a profitable and efficient operation.
Key People and Governance: David Zalman has served as Chairman and CEO, bringing decades of industry experience. The executive team includes Asylbek Osmonov as CFO and other seasoned leaders. The company follows a community-oriented governance model, focusing on local decision-making and personalized service.
Growth and Future: In February 2026, the company completed its merger with Southwest Bancshares, Inc., reflecting its active expansion strategy. With a focus on maintaining strong financial health, technological innovation, and community service, Prosperity Bancshares aims to continue its growth trajectory while upholding its founding principles of taking care of customers, businesses, and communities.
YoYYoY means Year-over-Year. It compares the latest annual value with the previous annual value to show long-term trend strength.
QoQQoQ means Quarter-over-Quarter. It compares the latest quarter with the immediately previous quarter to show short-term momentum changes.
RevenueThe total money that came through the front door from selling things, before paying a single bill. Think of it as the grand total of every credit card swipe from customers. (YoY compares this year to last year's performance, while QoQ compares the current three months to the previous three).
$1.7B
-0.2%
+29.1%
Net IncomeThe absolute bottom line. If the company paid every single supplier, employee, banker, and tax collector, this is the actual money left in their pocket at the end of the day.
$542.8M
+13.2%
+45.0%
Gross MarginThe basic markup. If they sell a $100 pair of sneakers, this percentage tells you how much of that price tag is profit right after paying for the rubber and shoelaces, but before paying for things like store rent or TV commercials.
+71.9%
+10.2%
+7.3%
Operating MarginThe 'day job' efficiency score. Out of every dollar a customer spends, this shows how many cents the company keeps after making the product AND paying for all the everyday corporate overhead (like salaries, marketing, and keeping the lights on).
+39.9%
+13.5%
+10.9%
Net MarginThe final take-home percentage. When you strip away every conceivable cost, tax, and interest payment, this is the exact number of cents the company truly gets to keep from every dollar in sales.
+31.2%
+13.5%
+12.3%
Free Cash FlowThe holy grail of corporate cash. It's the spendable, physical money left over after the business pays for its daily operations AND buys the big, expensive upgrades (like new factories or servers) it needs to survive. This is the 'free' money they can use to pay dividends or buy back stock.
$517.0M
+14.5%
-11.4%
FCF MarginThe ultimate cash conversion rate. It shows how good the company is at turning regular sales directly into cold, hard, spendable cash. A high percentage means the business is an absolute cash-printing machine.
+29.7%
+14.8%
-31.3%
Debt / EquityThe financial risk gauge. It compares how much of the company's empire was built using borrowed money (loans) versus the owners' own money (shareholders). A high number means they are heavily leveraged and playing a riskier game; a low number means they are playing it safe.
28.2%
-38.6%
+6.0%
Current RatioThe 12-month survival check. It simply compares the cash they have right now (plus things they can quickly turn into cash) against the immediate bills they absolutely must pay this year. A score above 1 means they have enough in the wallet to cover the upcoming bills without panicking.
0.43x
-5.4%
-3.5%
Total AssetsThe absolute size of the company's empire. It bundles together absolutely everything of value they own—from the cash in the register and the inventory in the warehouse, to the software patents in the vault and the factories on the ground.
Operator: Good day. And welcome to the Prosperity Bancshares Second Quarter Conference Call. All participants will be in listen-only mode. To ask a question, you may press star then one on a touchtone phone. Please note this event is being recorded. I would now like to turn the conference over to Charlotte Rasche. Please go ahead.
Charlotte Rasche: Thank you. Good morning, ladies and gentlemen. And welcome to Prosperity Bancshares' Second Quarter 2026 Earnings Conference Call. This call is being broadcast live on our website and will be available for replay for the next few weeks. I am Charlotte Rasche, executive vice president and general counsel of Prosperity Bancshares. And here with me today is David E. Zalman, senior chairman and chief executive officer H.E. Tim Timanus, Jr., chairman; Asylbek Osmonov, chief financial officer; Eddie Safady, senior vice chairman; Kevin Hanigan, president and chief operating officer; Robert R. Franklin, Jr., vice chairman and former CEO of Stellar Bancorp Randy Hester, chief lending officer; Mays Davenport, director of corporate strategy; Bob Dowdell, executive vice president; and Ramon Vitulli, Houston area chairman and former president of Stellar Bancorp. David E. Zalman will lead off with a review of the highlights for the recent quarter. He will be followed by Asylbek Osmonov, who will review some of our recent financial statistics and Tim Timanus, who will discuss our lending activities including asset quality. Finally, we will open the call for questions. Before we begin, let me make the usual disclaimers. Certain of the matters discussed in this presentation may constitute forward-looking statements for purposes of the federal securities laws. And as such may involve known and unknown risks, uncertainties, and other factors which may cause the actual results or performance of Prosperity Bancshares to be materially different from future results or performance expressed or implied by such forward-looking statements. Additional information concerning factors that could cause actual results to be materially different than those in the forward-looking statements can be found in Prosperity Bancshares' filings with the Securities and Exchange Commission, including Forms 10-Q and 10-Ks and other reports and statements we have filed with the SEC. All forward-looking statements are expressly qualified in their entirety by these cautionary statements. Now let me turn the call over to David E. Zalman.
David E. Zalman: Thank you, Charlotte. I would like to welcome and thank everyone listening to our second quarter 2026 conference call. I am excited to announce that on July 1, 2026, Prosperity Bancshares completed the merger of Stellar Bancorp its wholly owned subsidiary Stellar Bank. Headquartered in Houston, Texas. Stellar Bank operated 52 banking offices including its main office in Houston and banking offices the Houston, Beaumont and East Texas areas, and in Dallas, Texas. I am also pleased to announce that …