GuruFocus7/26/2026Neutral
Siemens advances self-verifying agentic AI workflows for semiconductor and PCB design
Siemens advances self-verifying agentic AI workflows for semiconductor and PCB design PR Newswire PLANO, Texas,

PCB Bancorp operates as the bank holding company for PCB Bank that provides various banking products and services to small and middle ...
Plutux is not an investment adviser. Market data and AI-generated analysis are for information and education only, not investment advice. Disclaimer
Est. EPS $0.73 · Revenue $31.93M · 2 analysts
Est. EPS $0.74 · Revenue $32.30M · 2 analysts
Est. EPS $2.95 · Revenue $125.13M · 2 analysts
Est. EPS $0.71 · Revenue $32.23M · 1 analysts
$0.84 per share
$0.84 per share
| Metric | Latest | YoYYoY means Year-over-Year. It compares the latest annual value with the previous annual value to show long-term trend strength. | QoQQoQ means Quarter-over-Quarter. It compares the latest quarter with the immediately previous quarter to show short-term momentum changes. |
|---|---|---|---|
| RevenueThe total money that came through the front door from selling things, before paying a single bill. Think of it as the grand total of every credit card swipe from customers. (YoY compares this year to last year's performance, while QoQ compares the current three months to the previous three). | $209.4M | +9.1% | +2.0% |
| Net IncomeThe absolute bottom line. If the company paid every single supplier, employee, banker, and tax collector, this is the actual money left in their pocket at the end of the day. | $37.5M | +45.1% | -1.4% |
| Gross MarginThe basic markup. If they sell a $100 pair of sneakers, this percentage tells you how much of that price tag is profit right after paying for the rubber and shoelaces, but before paying for things like store rent or TV commercials. | +53.3% | +6.3% | -1.8% |
| Operating MarginThe 'day job' efficiency score. Out of every dollar a customer spends, this shows how many cents the company keeps after making the product AND paying for all the everyday corporate overhead (like salaries, marketing, and keeping the lights on). | +25.1% | +32.6% | -3.6% |
| Net MarginThe final take-home percentage. When you strip away every conceivable cost, tax, and interest payment, this is the exact number of cents the company truly gets to keep from every dollar in sales. | +17.9% | +33.0% | -3.3% |
| Free Cash FlowThe holy grail of corporate cash. It's the spendable, physical money left over after the business pays for its daily operations AND buys the big, expensive upgrades (like new factories or servers) it needs to survive. This is the 'free' money they can use to pay dividends or buy back stock. | $24.4M | -30.1% | -93.3% |
| FCF MarginThe ultimate cash conversion rate. It shows how good the company is at turning regular sales directly into cold, hard, spendable cash. A high percentage means the business is an absolute cash-printing machine. | +11.7% | -35.9% | -93.5% |
| Debt / EquityThe financial risk gauge. It compares how much of the company's empire was built using borrowed money (loans) versus the owners' own money (shareholders). A high number means they are heavily leveraged and playing a riskier game; a low number means they are playing it safe. | 18.5% | +99.4% | +56.2% |
| Current RatioThe 12-month survival check. It simply compares the cash they have right now (plus things they can quickly turn into cash) against the immediate bills they absolutely must pay this year. A score above 1 means they have enough in the wallet to cover the upcoming bills without panicking. | 0.16x | +18.3% | +510.7% |
| Total AssetsThe absolute size of the company's empire. It bundles together absolutely everything of value they own—from the cash in the register and the inventory in the warehouse, to the software patents in the vault and the factories on the ground. | $3.3B | +7.1% | +2.2% |
| Metric | Annual (A vs E) | Annual Surprise | Quarter (A vs E) | Quarter Surprise |
|---|---|---|---|---|
| EPS Surprise | 2.58 vs 2.56 | +0.9% | 0.73 vs 0.70 | +4.3% |
| Revenue Surprise | $209.4M vs $115.8M | +80.8% | $53.2M vs $31.1M | +71.2% |
| Date | Executive | Title | Security | Side | Shares | Price |
|---|---|---|---|---|---|---|
| Aug 28, 2026 | KIM HENRY | director, officer: PRESIDENT, CEO & DIRECTOR | Common Stock | A | 1,000 | $14.75 |
| Aug 28, 2026 | KIM HENRY | director, officer: PRESIDENT, CEO & DIRECTOR | Stock option (right to buy) | D | 1,000 | $14.75 |
| Aug 19, 2026 | KIM HENRY | director, officer: PRESIDENT, CEO & DIRECTOR | Common Stock | A | 3,000 | $14.75 |
| Aug 19, 2026 | KIM HENRY | director, officer: PRESIDENT, CEO & DIRECTOR | Stock option (right to buy) | D | 3,000 | $14.75 |
| Aug 17, 2026 | KIM HENRY | director, officer: PRESIDENT, CEO & DIRECTOR | Common Stock | A | 3,000 | $14.75 |
| Name | Title | Compensation | Gender | Year Born | Status |
|---|---|---|---|---|---|
Henry Kim | President, Chief Executive Officer & Director | USD 1,072,180 | Male | 1967 | Active |
Timothy T. Chang | Senior EVP & CFO | USD 459,200 | Male | 1968 | Active |
David W. Kim | Senior EVP & Chief Banking Officer | USD 408,598 | Male | 1966 | Active |
Troy S. An | Executive Vice President & General Counsel | — | Male | — | Active |
Soo Yim Kyoung | Senior Vice President & Branch Manager of Irvine | — | — | — | Active |
Thomas Kim | Senior Vice President & Downtown Regional Manager of Downtown Fashion District | — | — | — | Active |
Joanne Kim | Senior Vice President and Branch Manager of Buena Park & Fullerton Branch | — | — | — | Active |
Hoon Jang Young | Senior Vice President & Branch Manager of Western | — | — | — | Active |
John Aragon | Executive Vice President & Chief Information Officer | — | Male | — | Active |
Hee Lee Joon | Senior Vice President & Manager of Consumer Loan Department | — | — | — | Active |
Siemens advances self-verifying agentic AI workflows for semiconductor and PCB design PR Newswire PLANO, Texas,
While the top- and bottom-line numbers for PCB Bancorp (PCB) give a sense of how the business performed in the quarter ended June 2026, it could be worth looking at how some of its key metrics compare to Wall Street estimates and year-ago values.

PCB Bancorp (PCB) came out with quarterly earnings of $0.73 per share, in line with the Zacks Consensus Estimate . This compares to earnings of $0.62 per share a year ago.
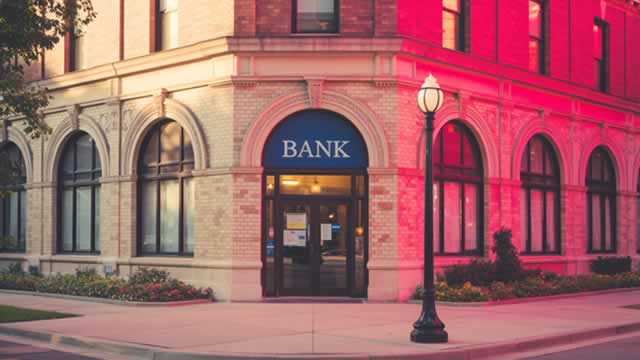
LOS ANGELES--(BUSINESS WIRE)--PCB Bancorp (the “Company”) (NASDAQ: PCB), the holding company of PCB Bank, announced that on July 22, 2026, its Board of Directors declared a quarterly cash dividend of $0.22 per common share. The dividend will be paid on or about August 14, 2026, to shareholders of record as of the close of business on August 7, 2026. About PCB Bancorp PCB Bancorp is the bank holding company for PCB Bank, a California state chartered bank, offering a full suite of commercial bank.

LOS ANGELES--(BUSINESS WIRE)--PCB Bancorp (the “Company”) (NASDAQ: PCB), the holding company of PCB Bank (the “Bank”), today reported net income available to common shareholders of $10.4 million, or $0.73 per diluted common share, for the second quarter of 2026, compared with $10.6 million, or $0.74 per diluted common share, for the previous quarter and $9.0 million, or $0.62 per diluted common share, for the year-ago quarter. Q2 2026 Highlights Net income available to common shareholders total.