Oshkosh Corporation provides purpose-built vehicles and equipment worldwide. The company operates through three segments: Access, Vocational, and Transport segment. The Access segment ...
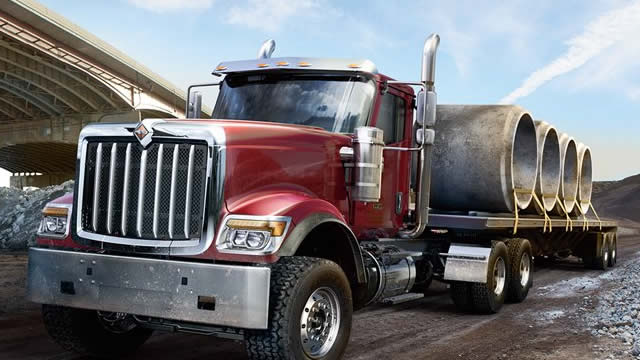
Oshkosh Corporation, formerly known as Oshkosh Truck Corporation, is an American industrial company founded in 1917 by William Besserdich and Bernhard Mosling. It has grown into a global leader in purpose-built vehicles and equipment, with approximately 18,400 employees and operations across 19 countries. The company is organized into three segments: ...Oshkosh Corporation, formerly known as Oshkosh Truck Corporation, is an American industrial company founded in 1917 by William Besserdich and Bernhard Mosling. It has grown into a global leader in purpose-built vehicles and equipment, with approximately 18,400 employees and operations across 19 countries. The company is organized into three segments: Access, Vocational, and Transport. The Access segment designs and manufactures aerial work platforms, telehandlers, and towing equipment, offering rental and financing solutions. The Vocational segment produces firefighting vehicles, emergency response equipment, airport rescue vehicles, refuse collection vehicles, and concrete mixers. The Transport segment focuses on military tactical vehicles, including heavy and medium tactical wheeled vehicles, and related services for defense. The company's products are sold through direct sales, dealers, and distributors worldwide. Financially, Oshkosh has a market capitalization of approximately $9.6 billion, with a trailing P/E ratio of 17.66 and a dividend yield of 1.4%. Its revenue per share is about $170, and it maintains a healthy balance sheet with a debt-to-equity ratio of 0.244. Key leaders include CEO John C. Pfeifer, who has held the position since April 2021. The company is committed to innovation and sustainability, focusing on electric and autonomous technologies. With a rich history of over a century, Oshkosh continues to expand its global footprint, serving critical industries such as construction, defense, and emergency services.
YoYYoY means Year-over-Year. It compares the latest annual value with the previous annual value to show long-term trend strength.
QoQQoQ means Quarter-over-Quarter. It compares the latest quarter with the immediately previous quarter to show short-term momentum changes.
RevenueThe total money that came through the front door from selling things, before paying a single bill. Think of it as the grand total of every credit card swipe from customers. (YoY compares this year to last year's performance, while QoQ compares the current three months to the previous three).
$10.4B
-2.9%
+25.8%
Net IncomeThe absolute bottom line. If the company paid every single supplier, employee, banker, and tax collector, this is the actual money left in their pocket at the end of the day.
$647.0M
-5.0%
+325.1%
Gross MarginThe basic markup. If they sell a $100 pair of sneakers, this percentage tells you how much of that price tag is profit right after paying for the rubber and shoelaces, but before paying for things like store rent or TV commercials.
+17.5%
-4.9%
+22.4%
Operating MarginThe 'day job' efficiency score. Out of every dollar a customer spends, this shows how many cents the company keeps after making the product AND paying for all the everyday corporate overhead (like salaries, marketing, and keeping the lights on).
+9.1%
-3.7%
+135.8%
Net MarginThe final take-home percentage. When you strip away every conceivable cost, tax, and interest payment, this is the exact number of cents the company truly gets to keep from every dollar in sales.
+6.2%
-2.2%
+238.0%
Free Cash FlowThe holy grail of corporate cash. It's the spendable, physical money left over after the business pays for its daily operations AND buys the big, expensive upgrades (like new factories or servers) it needs to survive. This is the 'free' money they can use to pay dividends or buy back stock.
$618.0M
+129.7%
+283.2%
FCF MarginThe ultimate cash conversion rate. It shows how good the company is at turning regular sales directly into cold, hard, spendable cash. A high percentage means the business is an absolute cash-printing machine.
+5.9%
+136.4%
+245.6%
Debt / EquityThe financial risk gauge. It compares how much of the company's empire was built using borrowed money (loans) versus the owners' own money (shareholders). A high number means they are heavily leveraged and playing a riskier game; a low number means they are playing it safe.
34.1%
+47.2%
-5.1%
Current RatioThe 12-month survival check. It simply compares the cash they have right now (plus things they can quickly turn into cash) against the immediate bills they absolutely must pay this year. A score above 1 means they have enough in the wallet to cover the upcoming bills without panicking.
1.94x
+28.0%
+5.2%
Total AssetsThe absolute size of the company's empire. It bundles together absolutely everything of value they own—from the cash in the register and the inventory in the warehouse, to the software patents in the vault and the factories on the ground.
Operator : Greetings, welcome to the Oshkosh Corporation's second quarter 2026 results conference call. At this time, all participants are in a listen-only mode. A brief question-and-answer session will follow the formal presentation. If anyone should require operator assistance during the conference, please press star zero on your telephone keypad. As a reminder, this conference is being recorded. It is now my pleasure to introduce your host, Pat Davidson, Senior Vice President of Investor Relations for Oshkosh Corporation. Thank you, sir. You may begin.
Pat Davidson : Good morning, thanks for joining us. Earlier today, we published our second quarter 2026 results. A copy of that release is available on our website at oshkoshcorp.com. Today's call is being webcast and is accompanied by a slide presentation, which includes a reconciliation of GAAP to non-GAAP financial measures that we will use during this call and is also available on our website. The audio replay and slide presentation will be available on our website for approximately 12 months. Please refer now to slide two of that presentation. Our remarks that follow, including answers to your questions, contain statements that we believe to be forward-looking statements within the meaning of the Private Securities Litigation Reform Act. These forward-looking statements are subject to risks and other factors that could cause actual results to be materially different from those expressed or implied by such forward-looking statements. These risks, factors include, among others, factors that we listed in our release this morning and matters that we have described in our most recent Form 10-K and other filings we make with the SEC, as well as matters noted at our Investor Day in June 2025. We disclaim any obligation to update these forward-looking statements, which may not be updated until our next quarterly earnings conference call, if at all. Our presenters today are John Pfeifer, President and Chief Executive Officer, and Matt Field, Executive Vice President and Chief Financial Officer. Please turn to slide three, I'll turn it over to you, John.
John Pfeifer : Good morning, everyone, thank you for joining us today. In the second quarter, we delivered consolidated sales of $2.9 billion and adjusted earnings per share of $2.87. We continue to benefit from growth in our access segment with strong order intake of $1.5 billion. Additionally, we have robust backlogs at our transport and vocational segments, we're focused on increasing production, which is foundational to delivering our 2028 goals. We are building momentum and remain confident in our ability to deliver on our Investor Day targets. Within our vocational segment, we are continuing actions to modernize our fire truck manufacturing and expand production to better serve strong customer demand and support long-term growth. Over the past quarter, we have implemented production changes to improve throughput. To support these changes, we …