Northwest Natural Holding Company (NWN) operates primarily through its subsidiary, Northwest Natural Gas Company, delivering regulated natural gas to a diverse clientele ...
Northwest Natural Holding Company, commonly known as NW Natural Holdings, is a regulated utility and infrastructure company headquartered in Portland, Oregon. Its roots date to January 7, 1859, giving it more than 165 years of operating history in the Pacific Northwest. The company trades on the New York Stock Exchange ...Northwest Natural Holding Company, commonly known as NW Natural Holdings, is a regulated utility and infrastructure company headquartered in Portland, Oregon. Its roots date to January 7, 1859, giving it more than 165 years of operating history in the Pacific Northwest. The company trades on the New York Stock Exchange under the symbol NWN and operates primarily through Northwest Natural Gas Company, its regulated natural gas distribution subsidiary.
The core business is the delivery of natural gas through a large local distribution network serving residential, commercial, industrial, and transportation customers. The principal service territory covers Oregon and Southwest Washington, where the company supplies natural gas through approximately 786,000 meters and serves roughly 2 million people in more than 140 communities. Regulated utility rates and oversight provide the core business with relatively predictable demand and cash flows, although earnings can be affected by weather, customer usage, regulatory decisions, infrastructure spending, financing costs, and broader energy-policy developments.
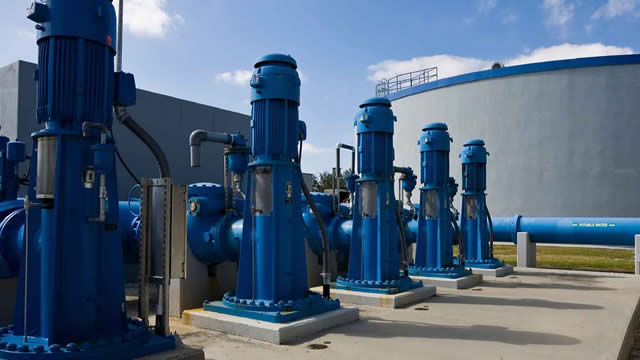
NWN also owns and operates the Mist underground natural gas storage facility in Oregon. Mist has approximately 5.7 billion cubic feet of storage capacity and is leased or made available to utilities and third-party energy marketers. Gas storage and asset-management services provide additional revenue opportunities beyond traditional distribution. The company has also expanded into water and wastewater utilities, serving approximately 80,000 people through around 33,000 connections across the Pacific Northwest and Texas. Other activities include non-regulated renewable natural gas investments, appliance retailing, and selected diversified infrastructure interests.
From a cost and capital perspective, NWN is an asset-intensive utility. Significant spending is required for pipeline replacement, safety improvements, system expansion, storage infrastructure, water assets, maintenance, and environmental compliance. The supplied trailing-twelve-month data indicates approximately $1.2 billion of annual revenue, a 37.5% EBITDA margin, a 9.7% net profit margin, and capital expenditures equivalent to about 45.9% of revenue. Capital expenditure exceeds depreciation, reflecting ongoing investment in long-lived utility assets. The company also carries substantial debt relative to equity and market capitalization, a common characteristic of regulated utilities, making interest rates and access to capital important financial considerations.
NWN has historically positioned itself as a dividend-paying utility. The supplied data shows an annual dividend of approximately $1.97 per share and a dividend yield near 3.9%, with a trailing payout ratio of roughly 78.4%. These distributions are supported by regulated operations but must be balanced against infrastructure investment, debt service, liquidity needs, and regulatory outcomes. The company’s current president and chief executive officer is Justin B. Palfreyman, who became CEO of NW Natural Holdings and NW Natural effective April 1, 2025. Overall, NWN’s strategic priorities include maintaining safe and reliable utility service, investing in resilient infrastructure, growing water and wastewater operations, developing lower-carbon gas opportunities, and preserving long-term shareholder value while managing affordability and decarbonization pressures.
YoYYoY means Year-over-Year. It compares the latest annual value with the previous annual value to show long-term trend strength.
QoQQoQ means Quarter-over-Quarter. It compares the latest quarter with the immediately previous quarter to show short-term momentum changes.
RevenueThe total money that came through the front door from selling things, before paying a single bill. Think of it as the grand total of every credit card swipe from customers. (YoY compares this year to last year's performance, while QoQ compares the current three months to the previous three).
$1.3B
+11.8%
-50.3%
Net IncomeThe absolute bottom line. If the company paid every single supplier, employee, banker, and tax collector, this is the actual money left in their pocket at the end of the day.
$113.3M
+43.7%
-99.4%
Gross MarginThe basic markup. If they sell a $100 pair of sneakers, this percentage tells you how much of that price tag is profit right after paying for the rubber and shoelaces, but before paying for things like store rent or TV commercials.
+39.6%
+14.7%
-1.3%
Operating MarginThe 'day job' efficiency score. Out of every dollar a customer spends, this shows how many cents the company keeps after making the product AND paying for all the everyday corporate overhead (like salaries, marketing, and keeping the lights on).
+31.4%
+89.3%
-69.6%
Net MarginThe final take-home percentage. When you strip away every conceivable cost, tax, and interest payment, this is the exact number of cents the company truly gets to keep from every dollar in sales.
+8.8%
+28.5%
-98.8%
Free Cash FlowThe holy grail of corporate cash. It's the spendable, physical money left over after the business pays for its daily operations AND buys the big, expensive upgrades (like new factories or servers) it needs to survive. This is the 'free' money they can use to pay dividends or buy back stock.
$-197.8M
-1.9%
-568.4%
FCF MarginThe ultimate cash conversion rate. It shows how good the company is at turning regular sales directly into cold, hard, spendable cash. A high percentage means the business is an absolute cash-printing machine.
-15.3%
+8.9%
-1043.0%
Debt / EquityThe financial risk gauge. It compares how much of the company's empire was built using borrowed money (loans) versus the owners' own money (shareholders). A high number means they are heavily leveraged and playing a riskier game; a low number means they are playing it safe.
187.0%
+32.3%
+1.9%
Current RatioThe 12-month survival check. It simply compares the cash they have right now (plus things they can quickly turn into cash) against the immediate bills they absolutely must pay this year. A score above 1 means they have enough in the wallet to cover the upcoming bills without panicking.
0.72x
-16.1%
-3.5%
Total AssetsThe absolute size of the company's empire. It bundles together absolutely everything of value they own—from the cash in the register and the inventory in the warehouse, to the software patents in the vault and the factories on the ground.
Operator: Hello, everyone. Thank you for joining us, and welcome to the Northwest Natural Holding Company Q2 2026 Earnings Call. [Operator Instructions] I will now hand the conference over to Nikki Sparley, Director of Investor Relations.
Nikki Sparley: Thank you. Good morning, and welcome to our second quarter 2026 earnings call. In addition to the press release, a supplemental presentation is available on our Investor Relations website at ir.nwnaturalholdings.com. And following this call, a recording will also be available on our website. As a reminder, some things that will be said this morning contain forward-looking statements. They are based on management's assumptions, which may or may not occur. For a complete list of cautionary statements, refer to the language at the end of our press release. Additionally, our risk factors are provided in our 10-Q and 10-K filings. We also refer to certain non-GAAP financial measures. For additional disclosures around these non-GAAP measures, including reconciliations to comparable GAAP measures, please see the slides that accompany today's call, which are available on the Investor Relations page of our website. Please note, our guidance assumes continued customer growth, average weather conditions, and no significant changes in prevailing regulatory policies, mechanisms or assumed outcomes or significant changes in local, state or federal laws, legislation or regulations. We expect to file our 10-Q later today. With us today are Justin Palfreyman, President and Chief Executive Officer; and Ray Kaszuba, Senior Vice President and Chief Financial Officer. Justin will provide highlights from the second quarter 2026, a regulatory update and a look forward. Ray will walk through our financial results and guidance. After Justin and Ray's prepared remarks, we will host a question-and-answer session. With that, I will turn the call over to Justin.
Justin Palfreyman: Thanks, Nikki. Good morning, everyone. The second quarter represented another solid quarter of performance for Northwest Natural Holdings, adding to our growing track record of consistent earnings results. Earnings per share for both the quarter and year-to-date surpassed our expectations, reflecting disciplined execution across the company. Our teams are demonstrating operational excellence and delivering healthy financial results while continuing to advance key regulatory initiatives and growth projects that lay the groundwork for continued success for years to come. I'm pleased to announce that we now expect 2026 EPS to be in the top half of our guidance range of $2.95 to $3.15 per share. This is driven by our strong year-to-date performance and improved visibility into the second half of the year as we have clarity regarding our key regulatory initiatives and continue to manage costs effectively. With that, let's review our business segments and key regulatory and project updates. Starting in Texas. SiEnergy had another outstanding quarter, …