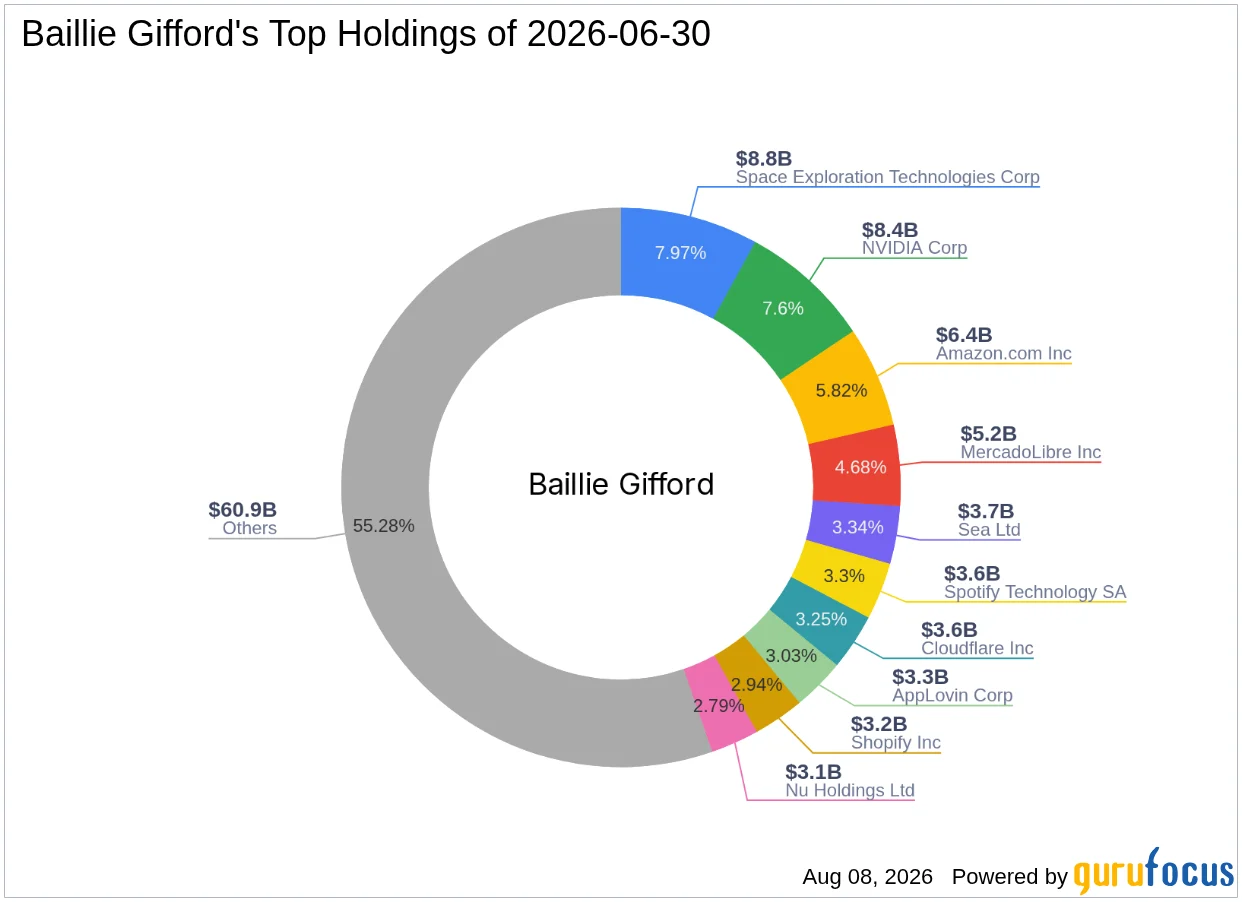
Nu Holdings Ltd. provides digital banking platform in Brazil, Mexico, Colombia, the Cayman Islands, and the United States. The company provides spending ...
Nu Holdings Ltd. (NYSE: NU), operating primarily under the Nubank brand, is a digital-first financial services company focused on serving everyday customers through mobile and online channels. Headquartered in São Paulo, Brazil, the company provides a broad set of banking and fintech products designed to reduce friction versus traditional branches—customers ...Nu Holdings Ltd. (NYSE: NU), operating primarily under the Nubank brand, is a digital-first financial services company focused on serving everyday customers through mobile and online channels. Headquartered in São Paulo, Brazil, the company provides a broad set of banking and fintech products designed to reduce friction versus traditional branches—customers typically interact through the Nu app for accounts, payments, borrowing, investing, and related services.
From a business and distribution perspective, Nu’s model centers on scaling a large customer base using digital onboarding and self-service experiences. Its core spending and account products include credit and prepaid cards (including premium/packaged tiers such as Nubank+ and Ultraviolet), a digitally enabled payment experience for transfers and bill payments, and NuAccount personal financial accounts. For merchants and entrepreneurs, it also offers Nu business accounts plus corresponding business card and prepaid/credit solutions.
On the lending side, Nu provides unsecured and secured personal loans and additional credit-linked financing features such as instant peer-to-peer transfer financing (Pix financing for card and digital account customers), boleto financing (enabling bill payments), purchase financing, and other cash-in-related financing offerings. These products are designed to meet short- and medium-term consumer and SME needs while being integrated into the same app-based ecosystem.
Nu also expands beyond traditional banking with savings and wealth-building solutions. The company offers goal-based investing tools (e.g., Money Boxes), investing guidance through its app, and NuCrypto, which enables buying and selling cryptocurrencies via the Nu platform. In addition, Nu’s protection offering includes insurance solutions spanning life, mobile, auto, home, and financial protection insurance.
The “digital banking + ecosystem” approach is likely to influence cost structure: rather than physical branch infrastructure, Nu leans on software and automated servicing, meaning a higher share of technology, data, risk/credit underwriting, and customer support operations relative to branch-based costs. While exact BOM/cost line items are not provided here, the company’s model generally implies lower marginal servicing costs per incremental user once core platforms are built, alongside ongoing investments in platform reliability, fraud/risk controls, compliance, and product development.
Financially, the dataset provided indicates the company operates at scale with thousands of employees (10,027 full-time employees reported) and significant market valuation. Reported operating and profitability margins in the provided snapshot suggest ongoing investment and balance-sheet utilization typical for growth-stage consumer finance and digital banking platforms. Nu’s key people structure highlights David Vélez Osorno as Founder, Chairman of the Board, and Chief Executive Officer, aligning leadership with product and platform execution since the company’s early formation.
Overall, Nu’s strategic “one app, multiple financial products” platform aims to deepen customer engagement (cards, payments, loans, investing, and insurance) while maintaining broad regional reach across Latin America and select international markets.
YoYYoY means Year-over-Year. It compares the latest annual value with the previous annual value to show long-term trend strength.
QoQQoQ means Quarter-over-Quarter. It compares the latest quarter with the immediately previous quarter to show short-term momentum changes.
RevenueThe total money that came through the front door from selling things, before paying a single bill. Think of it as the grand total of every credit card swipe from customers. (YoY compares this year to last year's performance, while QoQ compares the current three months to the previous three).
$15.9B
+43.0%
+10.8%
Net IncomeThe absolute bottom line. If the company paid every single supplier, employee, banker, and tax collector, this is the actual money left in their pocket at the end of the day.
$2.9B
+45.5%
+21.6%
Gross MarginThe basic markup. If they sell a $100 pair of sneakers, this percentage tells you how much of that price tag is profit right after paying for the rubber and shoelaces, but before paying for things like store rent or TV commercials.
+44.8%
-2.4%
+12.7%
Operating MarginThe 'day job' efficiency score. Out of every dollar a customer spends, this shows how many cents the company keeps after making the product AND paying for all the everyday corporate overhead (like salaries, marketing, and keeping the lights on).
+24.4%
-3.2%
+16.9%
Net MarginThe final take-home percentage. When you strip away every conceivable cost, tax, and interest payment, this is the exact number of cents the company truly gets to keep from every dollar in sales.
+18.1%
+1.7%
+9.7%
Free Cash FlowThe holy grail of corporate cash. It's the spendable, physical money left over after the business pays for its daily operations AND buys the big, expensive upgrades (like new factories or servers) it needs to survive. This is the 'free' money they can use to pay dividends or buy back stock.
$3.5B
+57.1%
-127.5%
FCF MarginThe ultimate cash conversion rate. It shows how good the company is at turning regular sales directly into cold, hard, spendable cash. A high percentage means the business is an absolute cash-printing machine.
+22.0%
+9.8%
-105.3%
Debt / EquityThe financial risk gauge. It compares how much of the company's empire was built using borrowed money (loans) versus the owners' own money (shareholders). A high number means they are heavily leveraged and playing a riskier game; a low number means they are playing it safe.
46.2%
+298.1%
+1161.2%
Current RatioThe 12-month survival check. It simply compares the cash they have right now (plus things they can quickly turn into cash) against the immediate bills they absolutely must pay this year. A score above 1 means they have enough in the wallet to cover the upcoming bills without panicking.
0.59x
-38.0%
-70.0%
Total AssetsThe absolute size of the company's empire. It bundles together absolutely everything of value they own—from the cash in the register and the inventory in the warehouse, to the software patents in the vault and the factories on the ground.
Operator: Good evening, ladies and gentlemen. Welcome to Nu Holdings conference call to discuss the results for the second quarter of 2026. A slide presentation is accompanying today's webcast, which is available in Nu Investor Relations website, www.investors.nu in English and www.investidores.nu in Portuguese. This conference is being recorded, and the replay can also be accessed on the company's IR website. This call is also available in Portuguese [Operator Instructions] [Foreign Language] I would now like to turn the call over to Mr. Guilherme Souto, Investor Relations Officer at Nu Holdings. Mr. Souto, you may proceed.
Guilherme Souto: Thank you, operator, and thank you, everyone, for joining our earnings call today. With me on today's call are David Velez, our Founder, Chief Executive Officer and Chairman; and Rob Livingston, our Chief Financial Officer. All financial metrics discussed and presented today reflect our managerial P&L framework, which we introduced in the Q4 2025. These managerial measures are important to how we manage the business, but are not financial measures as defined under IFRS and may not be comparable to other companies. A full reconciliation report to the most directly comparable IFRS figures is available in our managerial P&L reconciliation report and in the appendix to this presentation. Unless otherwise noted, all growth rates discussed today are presented on a year-over-year FX-neutral basis. Today's discussion may include forward-looking statements, which are not guarantees of future performance and involve risks and uncertainties. Actual results may differ materially from those expressed or implied. Please refer to the forward-looking statements disclosure included in the earnings presentation for additional information. With that, I will now turn the call over to David. Please go ahead, David.
David Velez-Osomo: Hello, everyone, and thank you for joining us today. 13 years ago, we started with a simple hypothesis that a bank built on technology with no branches and no legacy to defend could serve hundreds of millions of people better and at a fraction of the cost. Today, I'm proud to announce that in the past quarter, for the first time, we generated more than $1 billion in net income. This milestone is the result of our customer obsession translated into an earnings-generating formula. It is also a testament to the tremendous work of our team here at Nubank. 13 years later, that hypothesis continues to play out exactly as we envisioned. Our customer base reached 139 million customers, including almost 118 million in Brazil, more than 5 million in Colombia. And in the end of July, Mexico just reached 16 million customers. Engagement continued to deepen alongside that growth. Our activity rate expanded sequentially to 83.5%, while Brazil surpassed 86% for the first time. The combination of more customers and deeper engagement continues to drive monetization with ARPAC reaching $17. Together, they generated …